For roughly the last ten years, a meaningful percentage of my working hours have been spent thinking about observability. If you're not familiar with the term, "observability" is what we call it now that "monitoring" doesn't sound expensive enough. The actual work is unglamorous in that you collect a lot of logs, some metrics, a few traces, and then you give them to people.
I generally like my job. I like that we're always trying new ideas and approaches. I like the fact that when things go wrong, the answer is almost always sitting there in the data, waiting to be found by whoever is patient enough to look. But I want to be honest with you: in ten years of doing this work, across a half-dozen companies and every observability platform you've heard of and a few you probably haven't, logs have never stopped being the worst part of the job. They were the worst part when I started. They are the worst part today. I fully expect them to be the worst part of this job forever until the robots rise up and rip my head off in one clean sweep.

I've written about why logs are terrible before, so I'll spare you the full lecture and give you the short version.
Every developer's expectations for logs are set by a single formative experience: the syslog box. Or a container running locally. Or tail -f on a production server they probably shouldn't have SSH'd into. The point is that at some early, tender moment in their career, they had an experience with logs that was flawless. They ran grep and something useful came back. They piped it into jq and got exactly what they needed.
This experience is the observability equivalent of a first kiss. It ruins them for everything that comes after.
Because here is the thing about that flawless experience: it works because the system is small, the volume is trivial, and the person querying is the same person who wrote the log line. There is no schema drift, no cardinality explosion, no cross-team consumer with dashboard expectations, no VP asking why the "revenue events" graph has a gap in it.
Then there are forty services. Now there are four hundred. Now the logs are being consumed not just by developers but by customer service, who need to look up a specific user's failed checkout from Tuesday. And by the data team, who are quietly building a business-critical dashboard on top of a log line that a backend engineer is about to refactor without telling anyone. And by the on-call, who at 3 AM does not want to learn a new query language, does not want to think about index patterns, and would like the search bar to just work.
So you have a technical problem — the volume is enormous, the shape is inconsistent, the queries are unpredictable — sitting on top of an expectations problem, which is worse. Developers want logs instantly, they want to run arbitrary operations on them, and they will not commit to a schema. Meanwhile the less-technical consumers of that same data want the dashboards to be stable forever, the UI to be forgiving, and the whole thing to feel like a normal product. These two audiences are, in most practical respects, at war with each other, and you are the diplomat.
Clickhouse
ClickHouse came out of Yandex, where it was built to chew through analytical queries against absurd volumes of clickstream data. It was not designed for observability. It just happens to be shockingly good at it, because clickstream data and observability data have a lot in common: high volume, append-heavy, time-ordered, mostly read in aggregate, and every so often you need to reach in and find one specific needle.
You can run it yourself with Helm charts. You can point Grafana at it via the ClickHouse plugin, or use their own web UI, or bring your own frontend. Their docs are actually good, which I mention because it's rare enough to be worth flagging. I've never used their ClickStack setup though, so YMMV.
For observability specifically, the OpenTelemetry Collector has a ClickHouse exporter, which means you can pipe OTLP data straight in and let it manage the initial schema for you. ClickHouse is designed to scan billions of rows and ingest an amount of data that, when you first see the numbers, makes you assume they're lying. They're not lying. You query it with SQL, which is a language that already exists and was not created by a startup two weeks ago.
But why Clickhouse specifically for logs?
I'm ranting about logs and then I'm explaining why I like to administer Clickhouse more. Let me take a second and explain why Clickhouse is really good at logs at scale.
Logs, as a data shape, have some peculiar properties. They're append-only. You never update a log line, and you almost never delete a single one, though you delete a lot of them at once when retention kicks in. They arrive roughly in time order, though never actually in order. They're read in bursts where nobody looks at logs for days, and then during an incident somebody wants to scan a billion of them in seconds. They're highly compressible, because most of the bytes in your logs are repeated: the same service names, the same hostnames, the same error strings, the same JSON keys, over and over and over again. And critically, when you query them, you almost always want either a narrow time range across all fields or an aggregation across a wide time range with a few filters. You very rarely want "give me one specific row by ID" the way you would from a transactional database. (There are exceptions when its something like GDPR or compliance logging which is its own subgenre of nightmares).
In a row-oriented database — Elasticsearch, Postgres, MySQL — the data for a single log line is stored together on disk. If your log has 40 fields and your query only cares about 3 of them, tough luck, you're reading all 40 from disk anyway. The database will filter it in memory, but the disk I/O has already happened.
ClickHouse stores each column separately. If your query says SELECT service, status_code, count() FROM logs WHERE timestamp > now() - INTERVAL 1 HOUR GROUP BY service, status_code, ClickHouse reads exactly three columns off disk: timestamp, service, and status_code. The other 37 columns in your schema might as well not exist. On observability data, where you often have dozens of attributes but any given query touches three or four, this is the difference between scanning 800GB and scanning 40GB.
This is also why the compression numbers look absurd. Columnar data compresses far better than row-oriented data because the values within a single column are, by nature, similar to each other. A column of service_name values might have a hundred distinct strings across a billion rows. ZSTD eats that for breakfast. You'll routinely see 10–14x compression ratios on real observability data, compared to 2–3x for Elasticsearch.
That's not the amazing part though
The amazing thing is that ClickHouse scales without changing shape.
I don't know how else to say this. Every other observability backend I've worked with mutates as it grows. The architecture at 1 TB a day and the architecture at 10 TB a day are recognizably different systems, with different failure modes, different ops burdens, and different mental models. ClickHouse at 10 TB a day looks like ClickHouse at 1 TB a day with more shards. That's it. That's the pitch. That's the whole reason I'm writing this.
Let me show you what I mean.
1 TB a Day
At 1 TB a day, every modern observability stack is roughly okay. If you're at this scale, you can pick almost anything and be productive. The differences below are real but they're not yet painful.
Elasticsearch
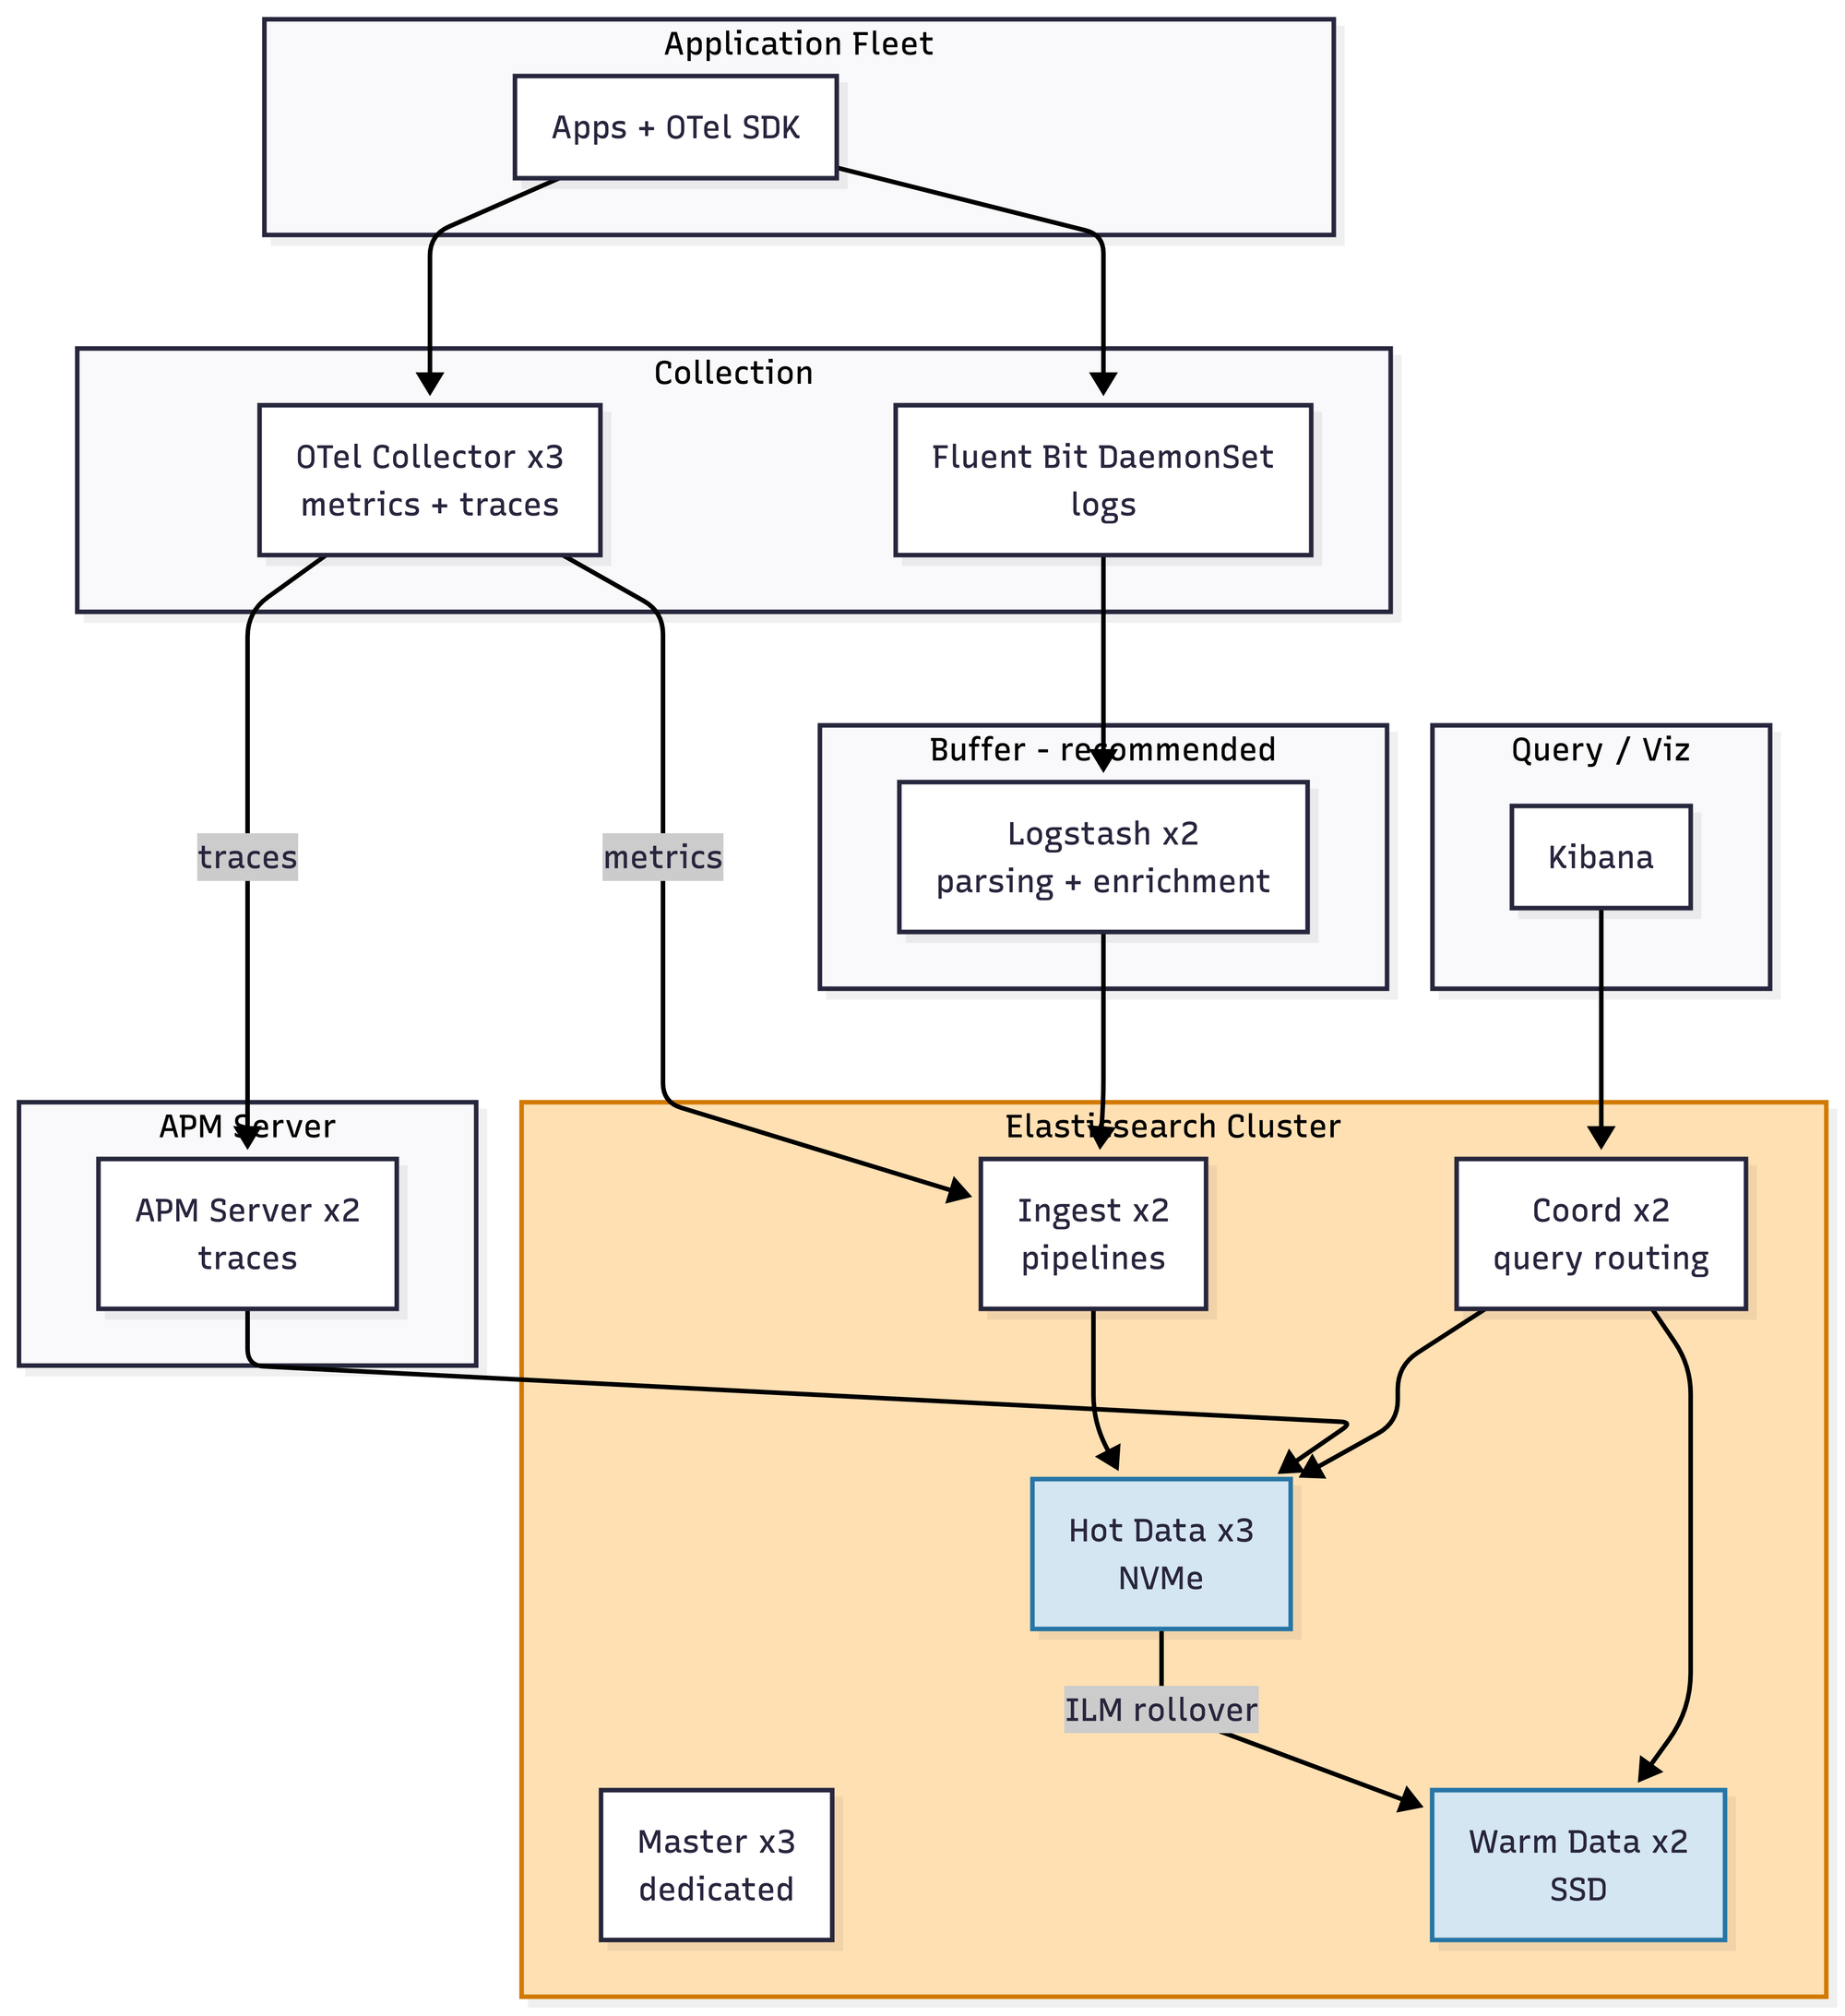
- A relatively vanilla Elasticsearch cluster with Logstash providing some buffer between ingest and the Lucene indexes. Users get full-text search, which is genuinely good — this is the thing Elasticsearch is actually best at, and at this scale it delivers. Mapping explosions are already a background risk with mixed data, so dynamic mapping needs to be disabled or carefully templated from day one. ILM policies (hot → warm → delete) are non-optional even at this size, because forgetting to set them is how you get paged on a Saturday about disk pressure. Roughly $6–9K/month.
LGTM
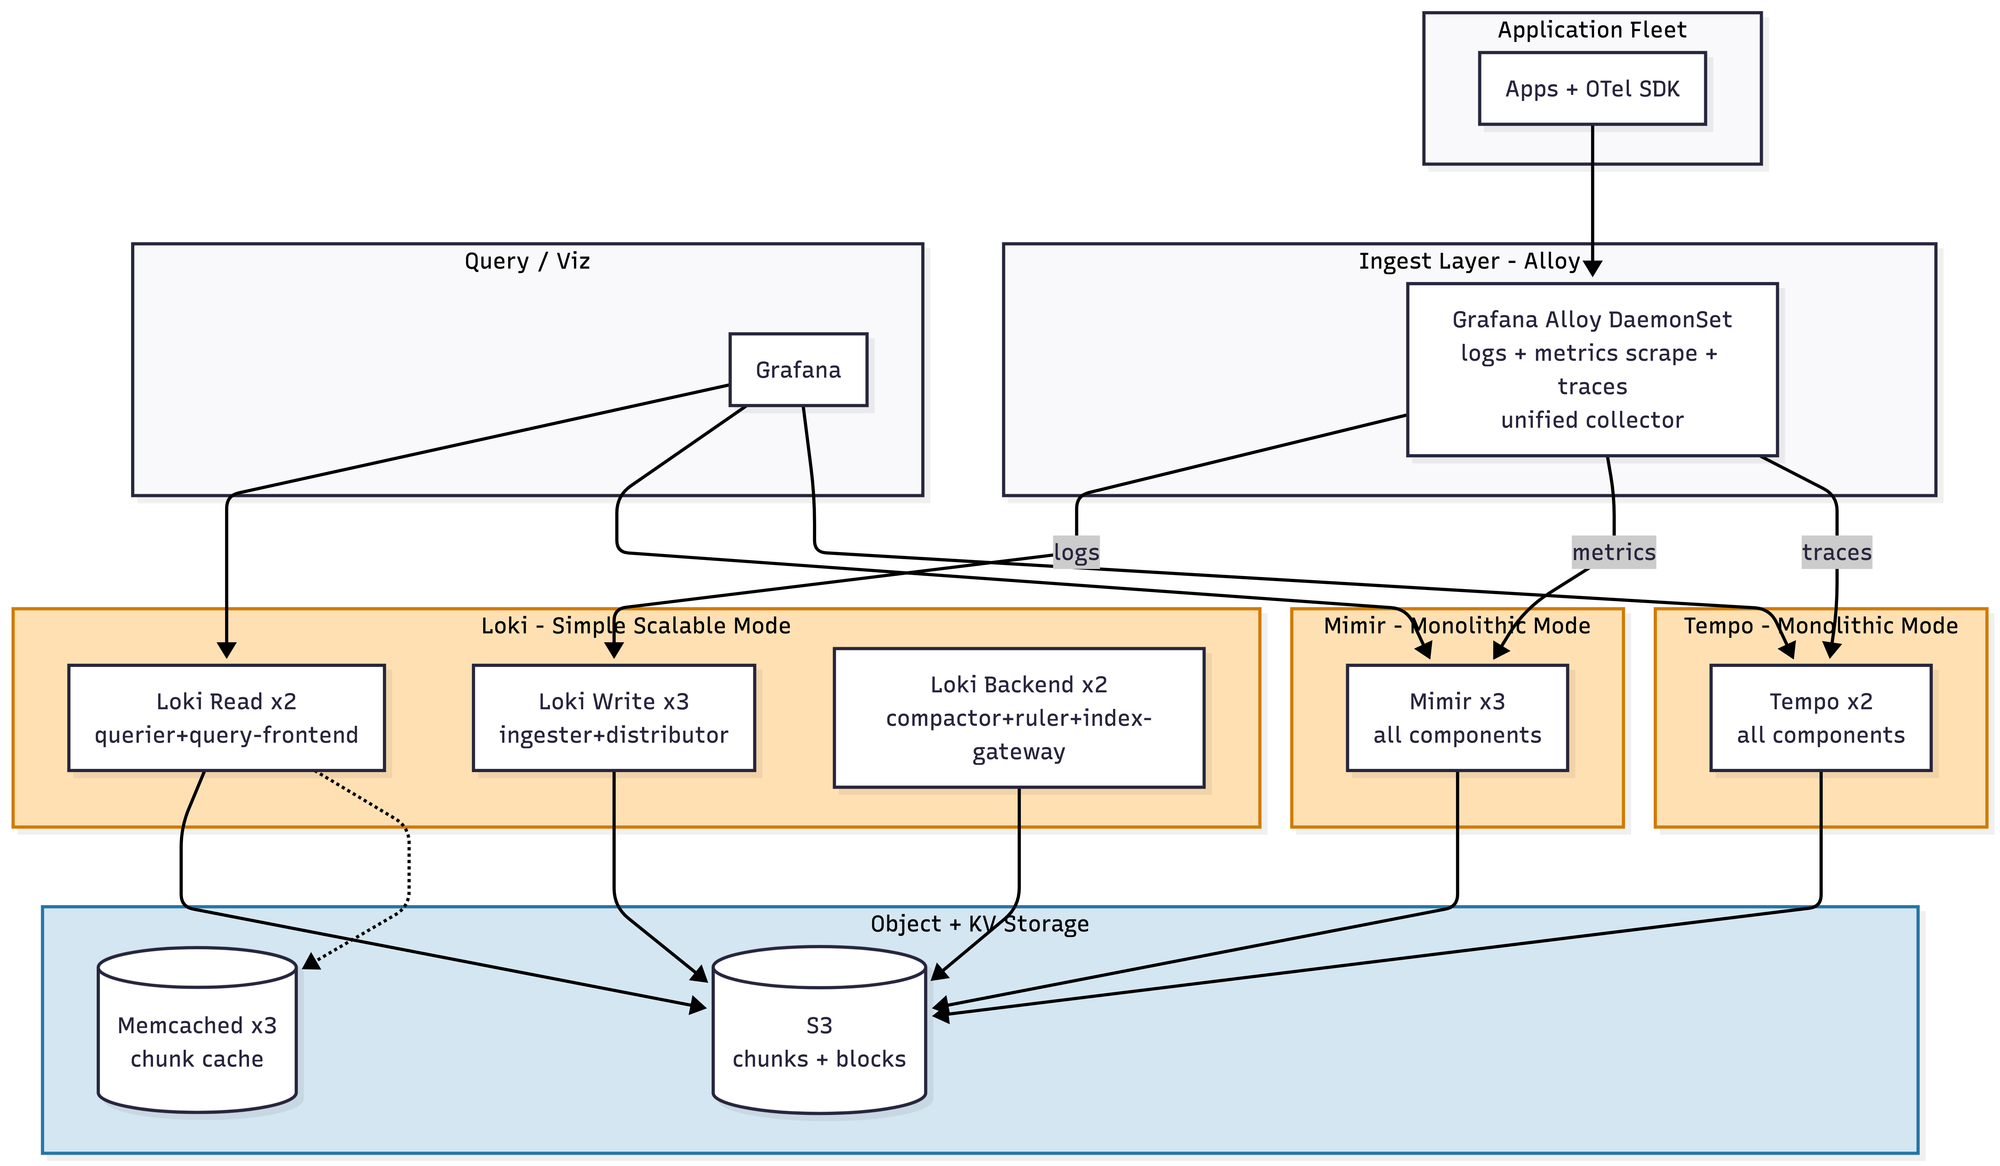
- Nothing too crazy. Alloy (formerly Grafana Agent, RIP) unifies the collection story into a single daemon, which is nice. Loki works well as long as you spend some time educating developers on how to attach useful labels — a conversation you will have many times, with many people, for the rest of your career. Mimir and Tempo largely do what it says on the tin. Roughly $3.5–5K/month.
Datadog
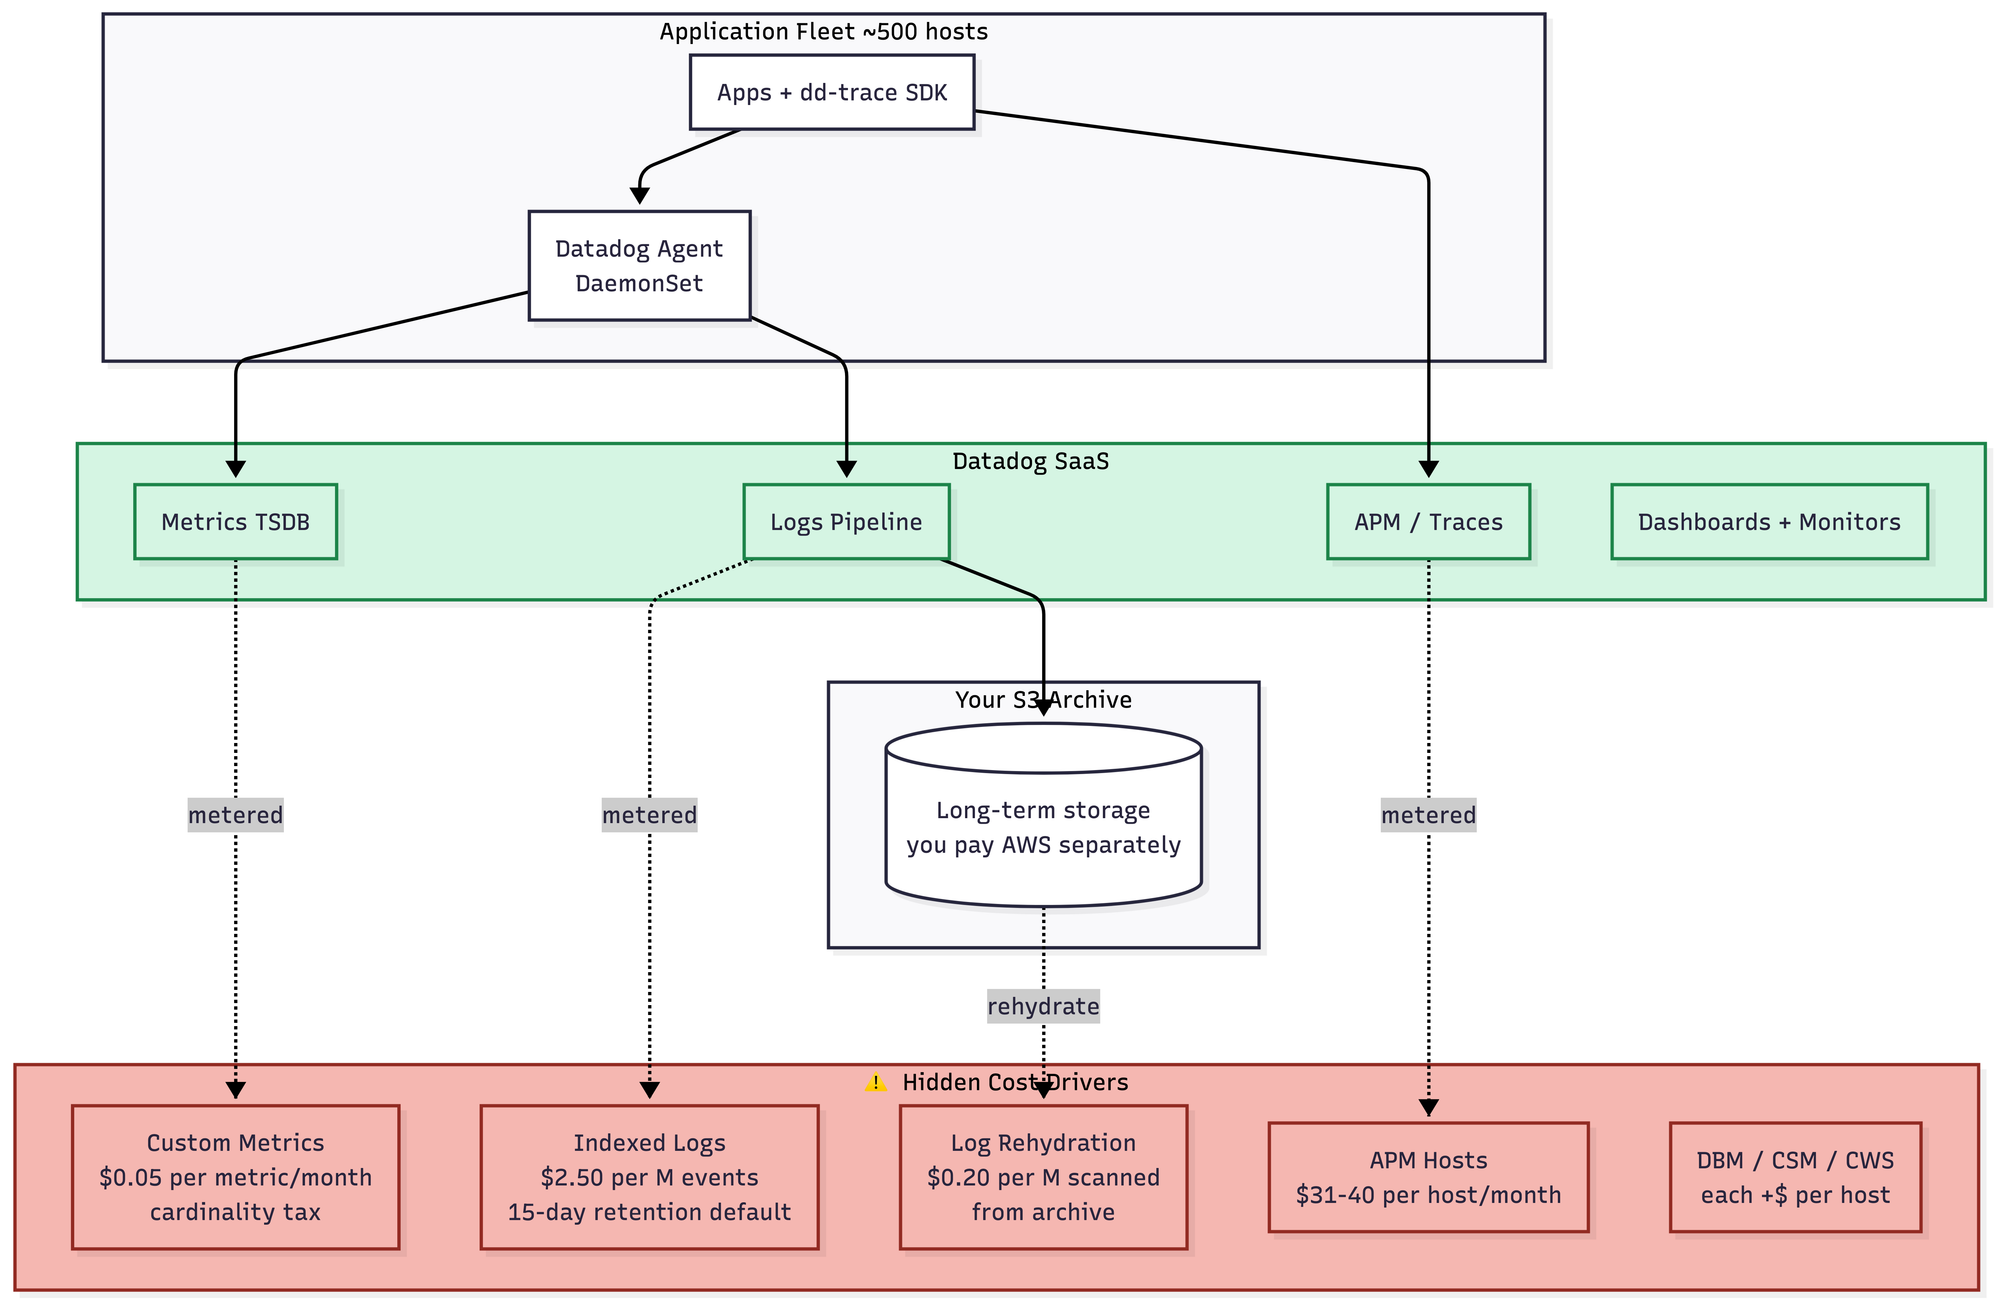
- At 1 TB a day, Datadog is genuinely great. This is the scale it was built for, and it shows. You install the agent, you look at dashboards, you go home. There is almost nothing to think about, which is the entire point. You can already see the shape of the cost problem lurking in the diagram — the metered pipelines, the indexed-vs-ingested logs distinction, the custom metrics cardinality tax — but at this scale it's manageable. Roughly $45–75K/month, though negotiated pricing varies enough that I'd take that number with a grain of salt the size of a fist.
- Datadog's whole pricing philosophy is that they save you a full-time engineer. I think that framing is somewhat deranged, but they are extremely rich and I am not, so consider your source.
Clickhouse
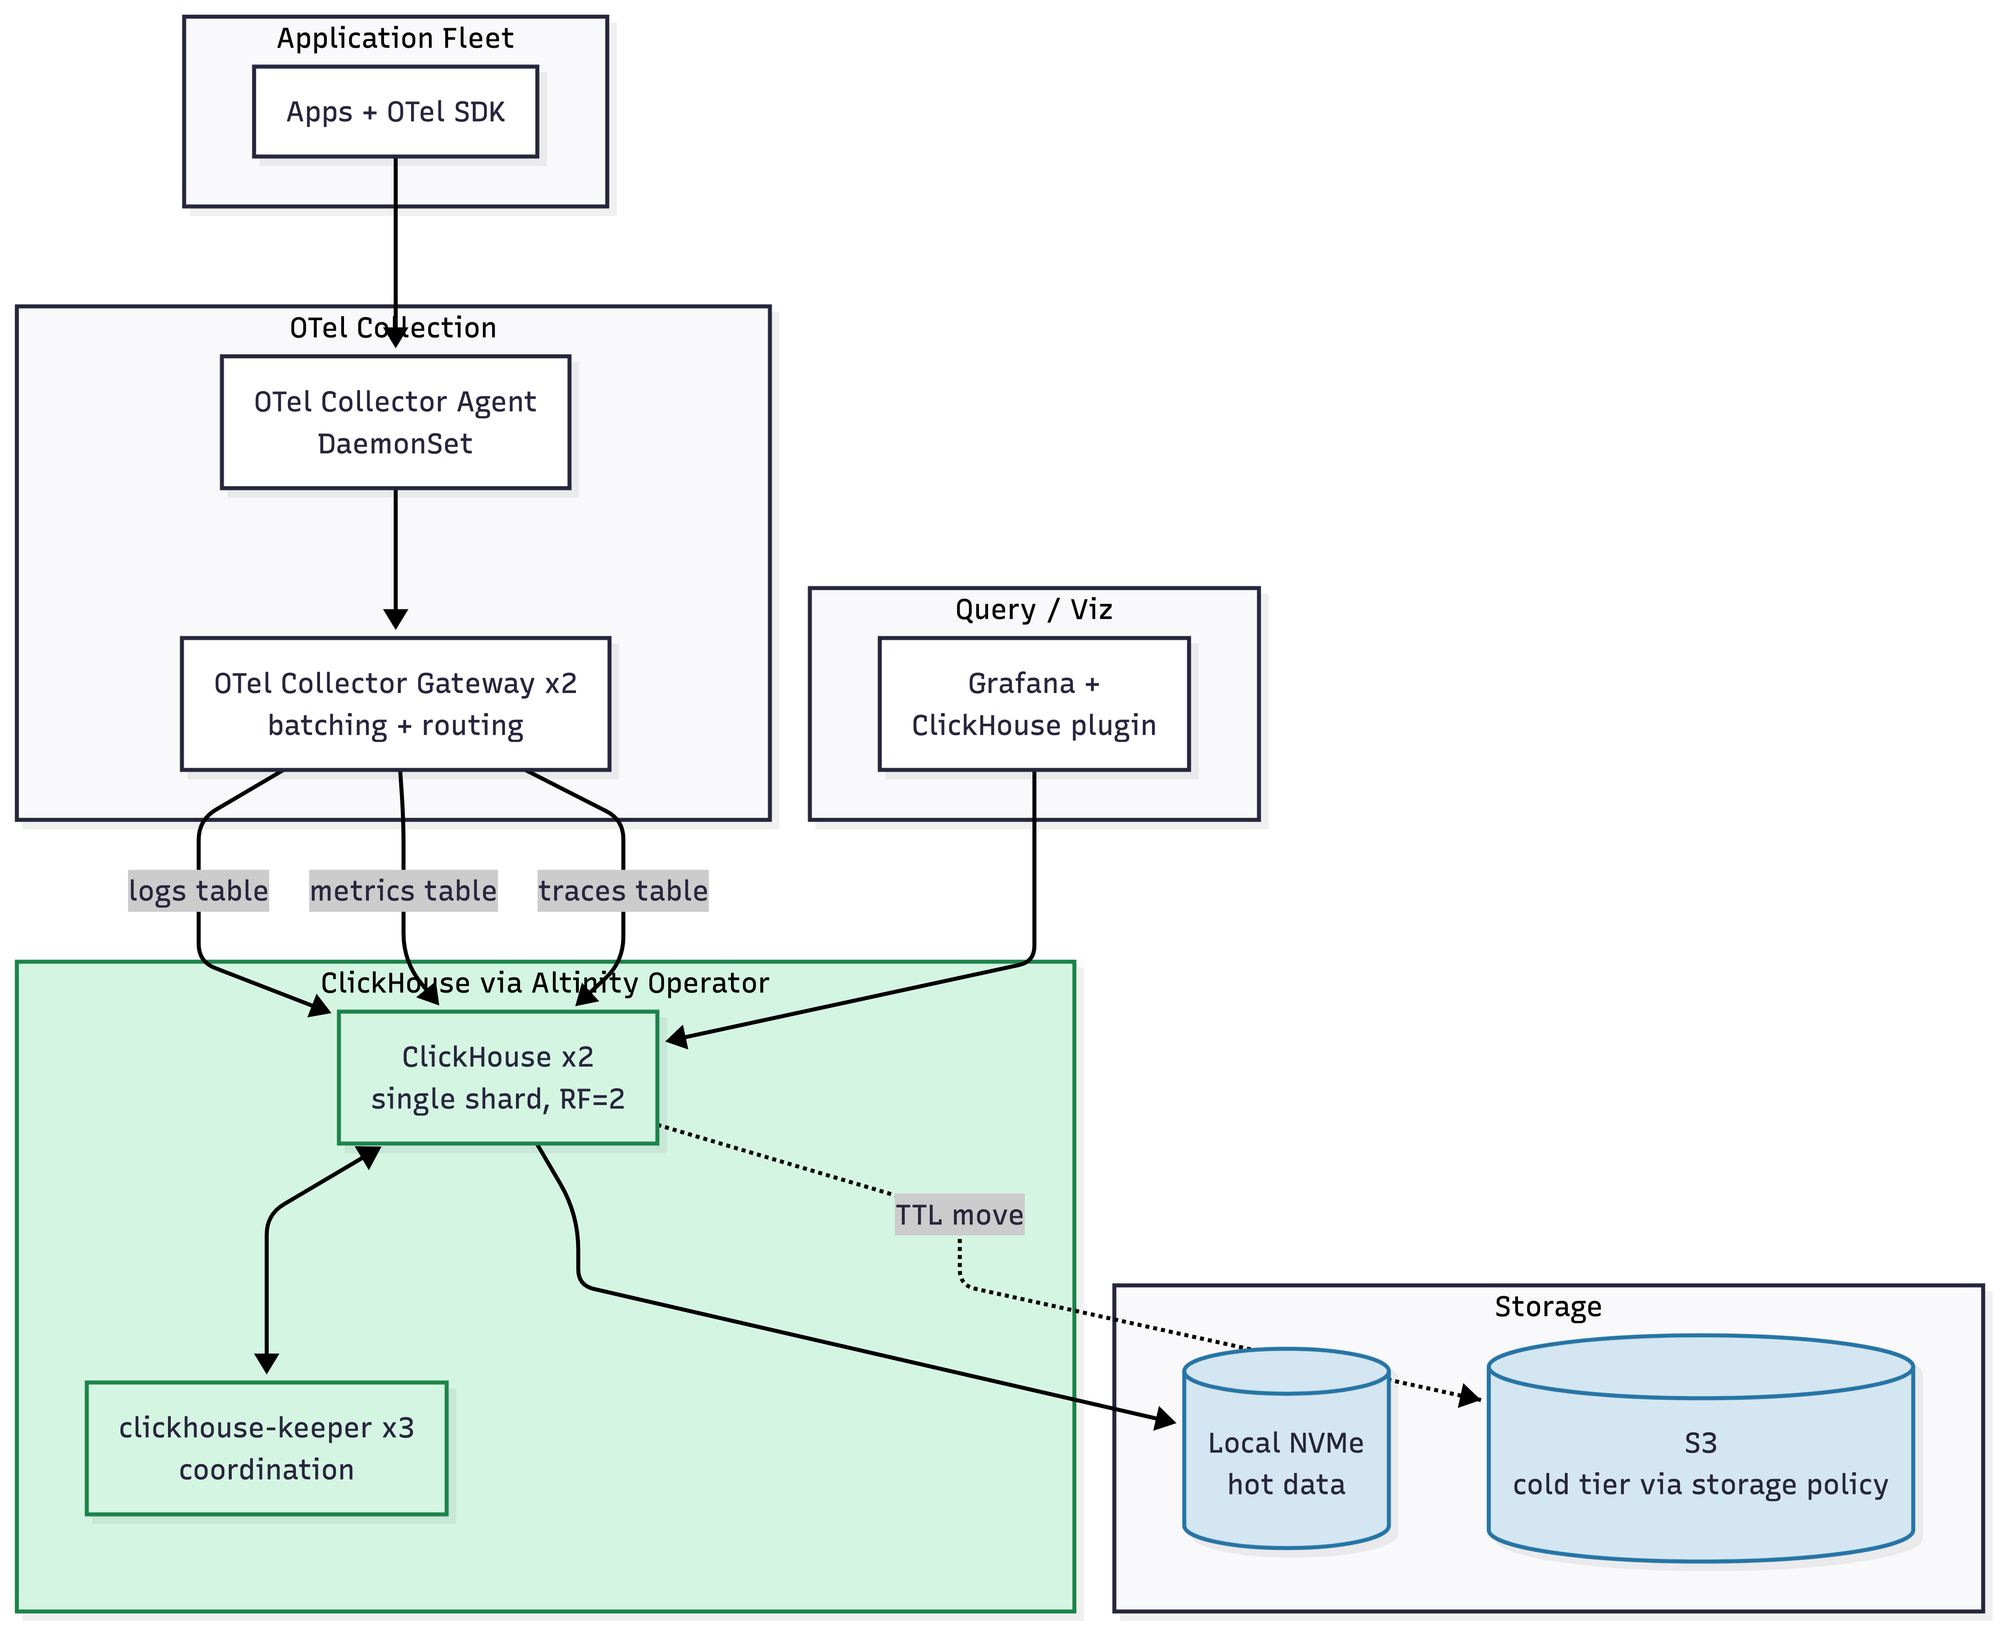
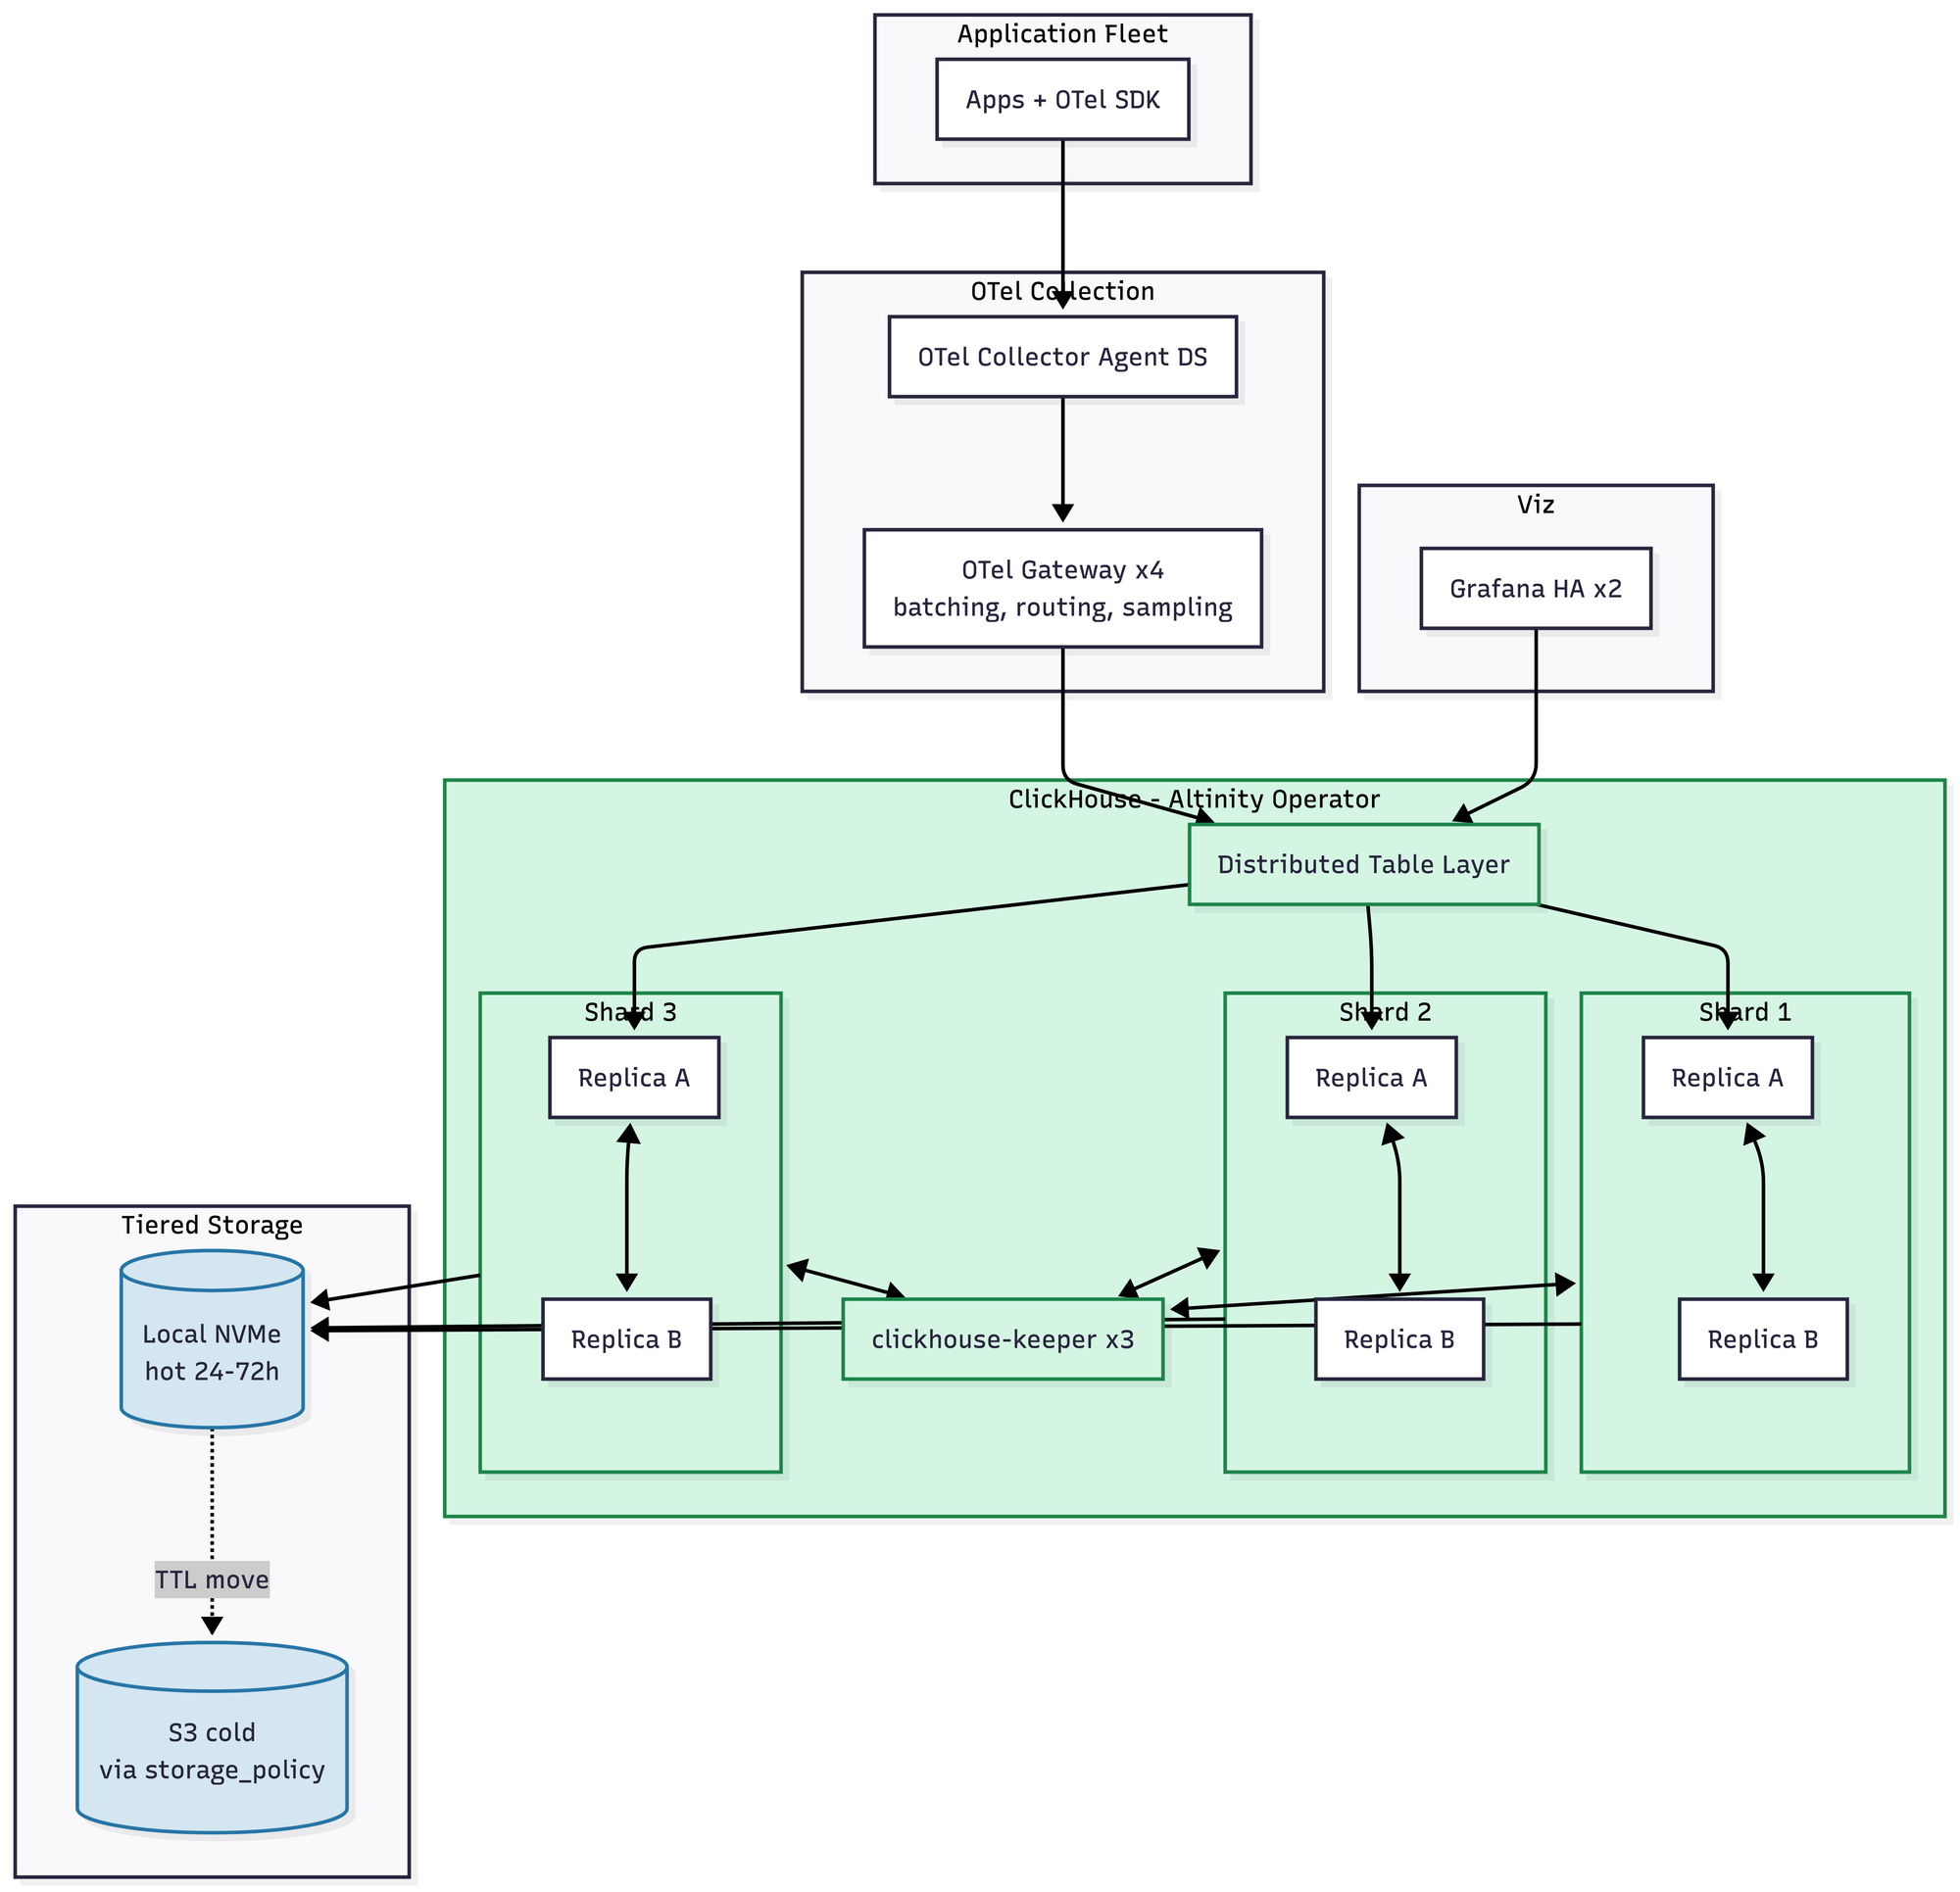
Here is the honest truth: at 1 TB a day, ClickHouse is not less complicated than its peers. It's roughly the same. Maybe slightly more, if you count the schema design work you have to do up front. You get 10–14x compression with ZSTD and proper codecs, the Altinity Operator handles keeper coordination and the whole thing runs in about seven pods. But you do have to design your schemas. ORDER BY keys matter enormously. There is no native PromQL, so metrics workflows go through the Grafana plugin or through chproxy and an adapter. Roughly $1.5–2.5K/month.
If you took the diagrams at this tier and squinted, you'd say they're all in the same weight class. And you'd be right. Now watch what happens next.
5 TB a Day
This is where the exponential curve kicks in for everybody except one of these.
Elasticsearch
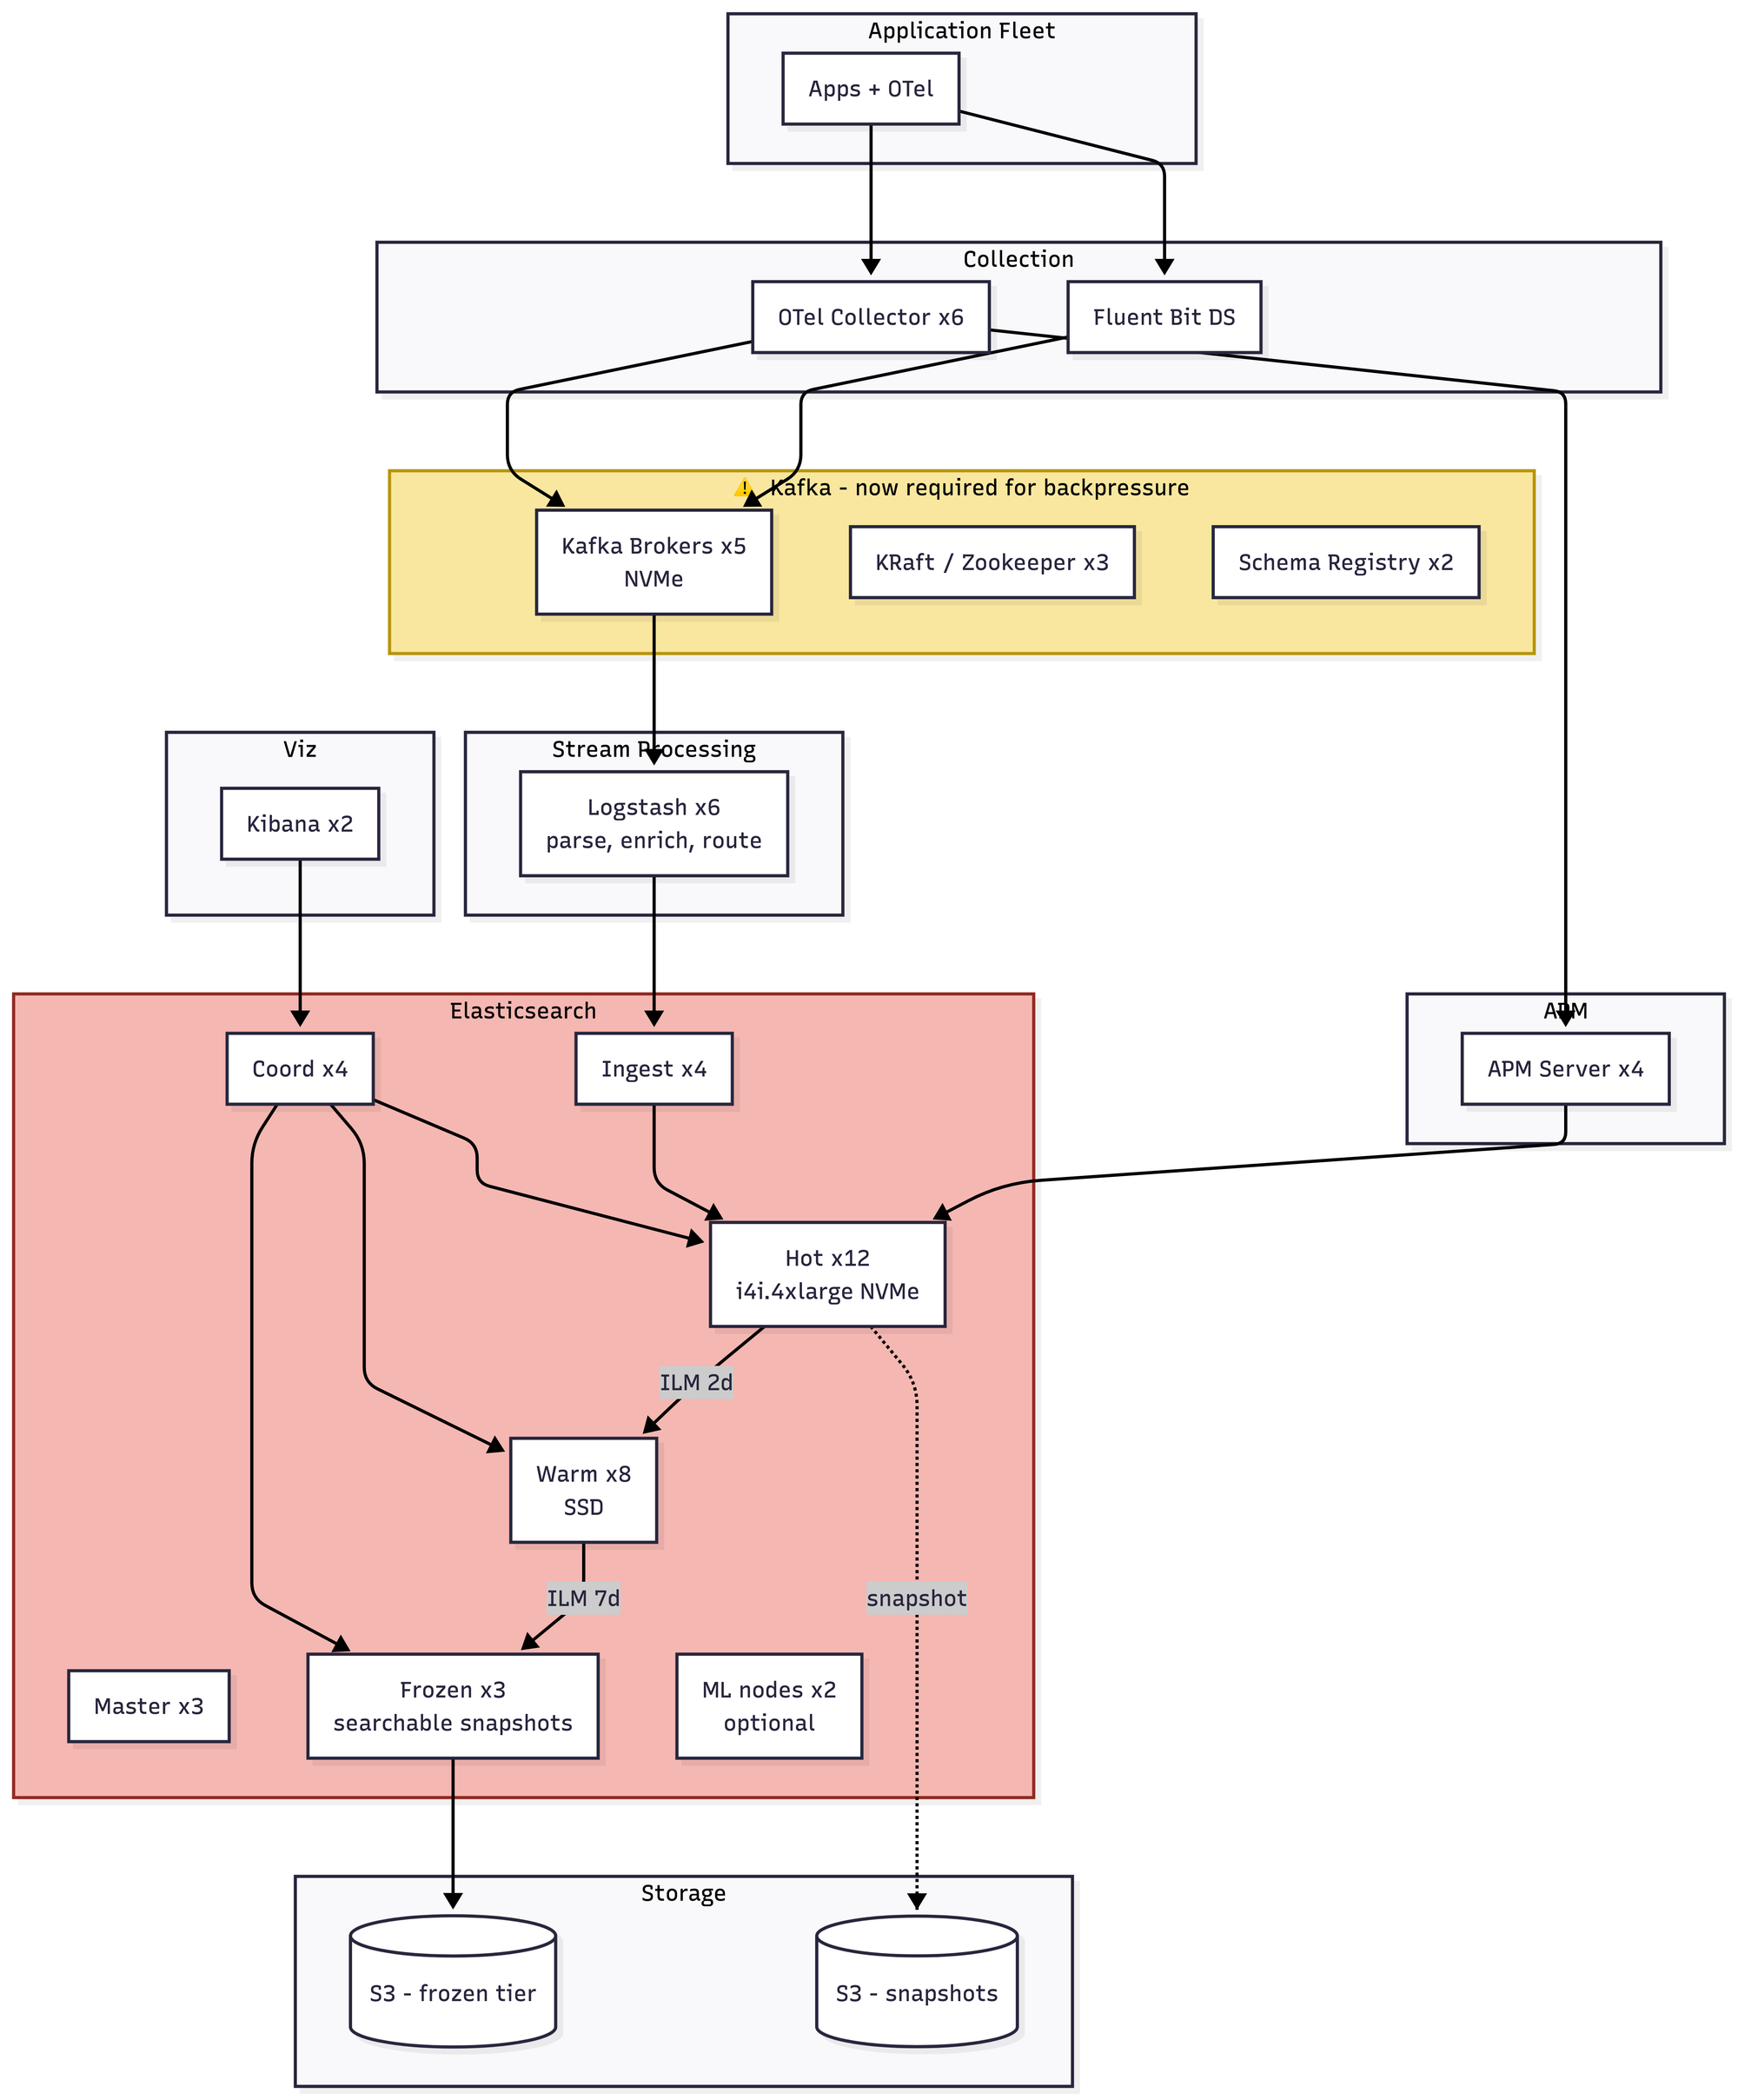
- Kafka is no longer optional. At 5 TB a day, direct writes into Elasticsearch cause bulk-reject storms and backpressure that will absolutely take your cluster down during a traffic spike. So now you're running Kafka, which means you're either running Kafka well or you're about to have a second, entirely different set of problems. Shard math becomes critical — at 50GB target shards, you're minting ~200 shards a day counting replicas, and your cluster state size becomes its own concern. You almost certainly need Elastic's commercial license for searchable snapshots and the frozen tier. Roughly $40–55K/month before licensing.
- That but Kafka
LGTM stack
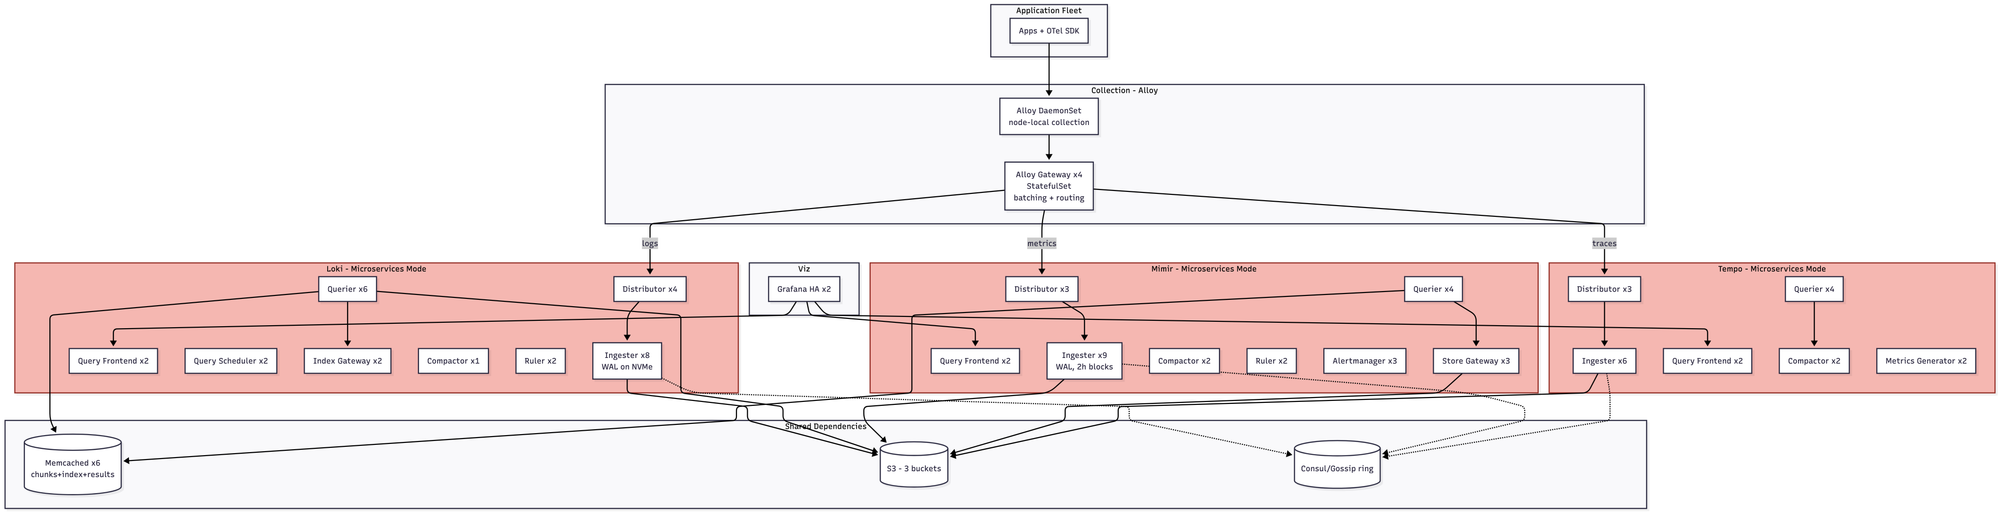
- You are now in microservices mode, whether you wanted to be or not. That means 65+ pods across three separate systems, each with its own compaction pipeline, its own hash ring, its own memcached tier. The gossip/memberlist ring becomes a real operational concern; ingester rollouts require careful -ingester.autoforget-unhealthy tuning, and if you get it wrong you either lose data or duplicate it. Roughly $22–32K/month.
Datadog
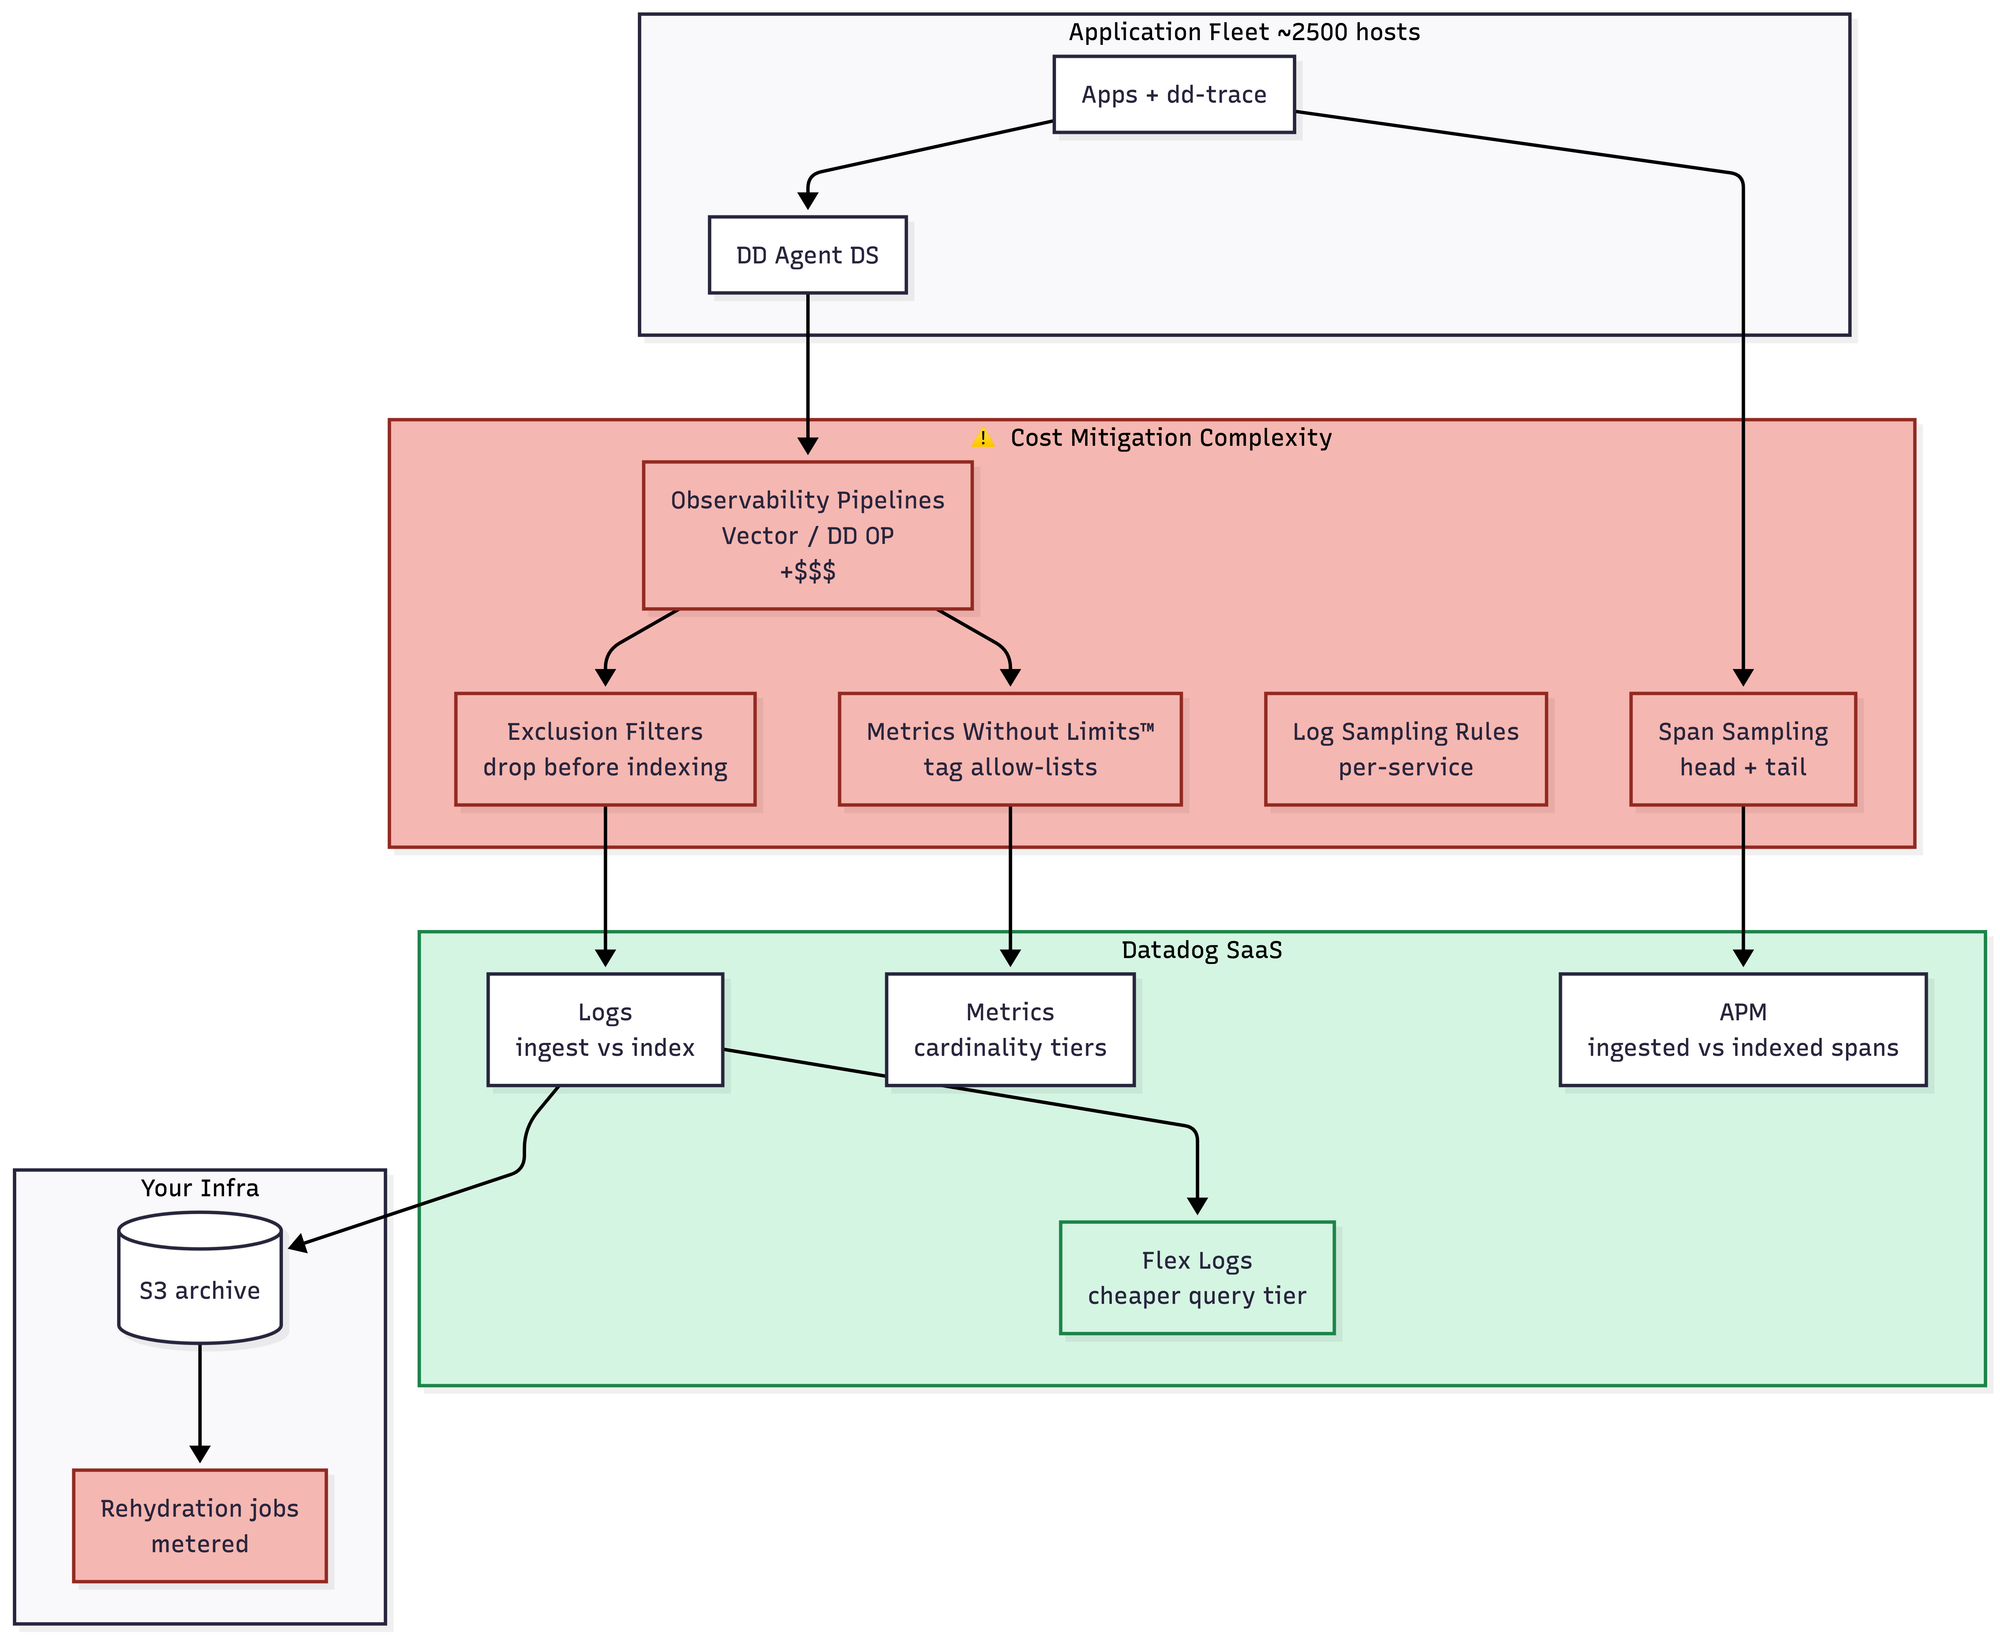
- The operational complexity is still low, in that you don't run any servers. But you now need a full pipeline team whose entire job is reducing your Datadog bill. Exclusion filters, sampling rules, cardinality caps, tag allow-lists, the whole apparatus. This is what I call the "you build a system to avoid using the system you're paying for" trap, and once you're in it, you are in it forever. Roughly $180–350K/month, depending on how aggressive the pipeline team gets.
- This is also where you are basically fighting with your SaaS provider all the time, pouring over their billing documentation to figure out how to reduce costs. It's a hostile relationship and one I don't enjoy.
Clickhouse
You'll notice, if you look at the diagram, that I basically just added shards. That's it. That's the change. Same operator, same query engine, same query language, same mental model. Rebalancing after adding shards is manual, which is a real trade-off — most teams pre-provision or use weighting on Distributed tables to sidestep it. Materialized views for dashboard rollups shift from "nice to have" to "essential." Roughly $7–11K/month.
The gap between ClickHouse and everything else opens up here. It doesn't close.
10 TB a Day
This is where most solutions genuinely stop working, in the sense that even a well-staffed internal team cannot keep up with the operational load.
Elasticsearch
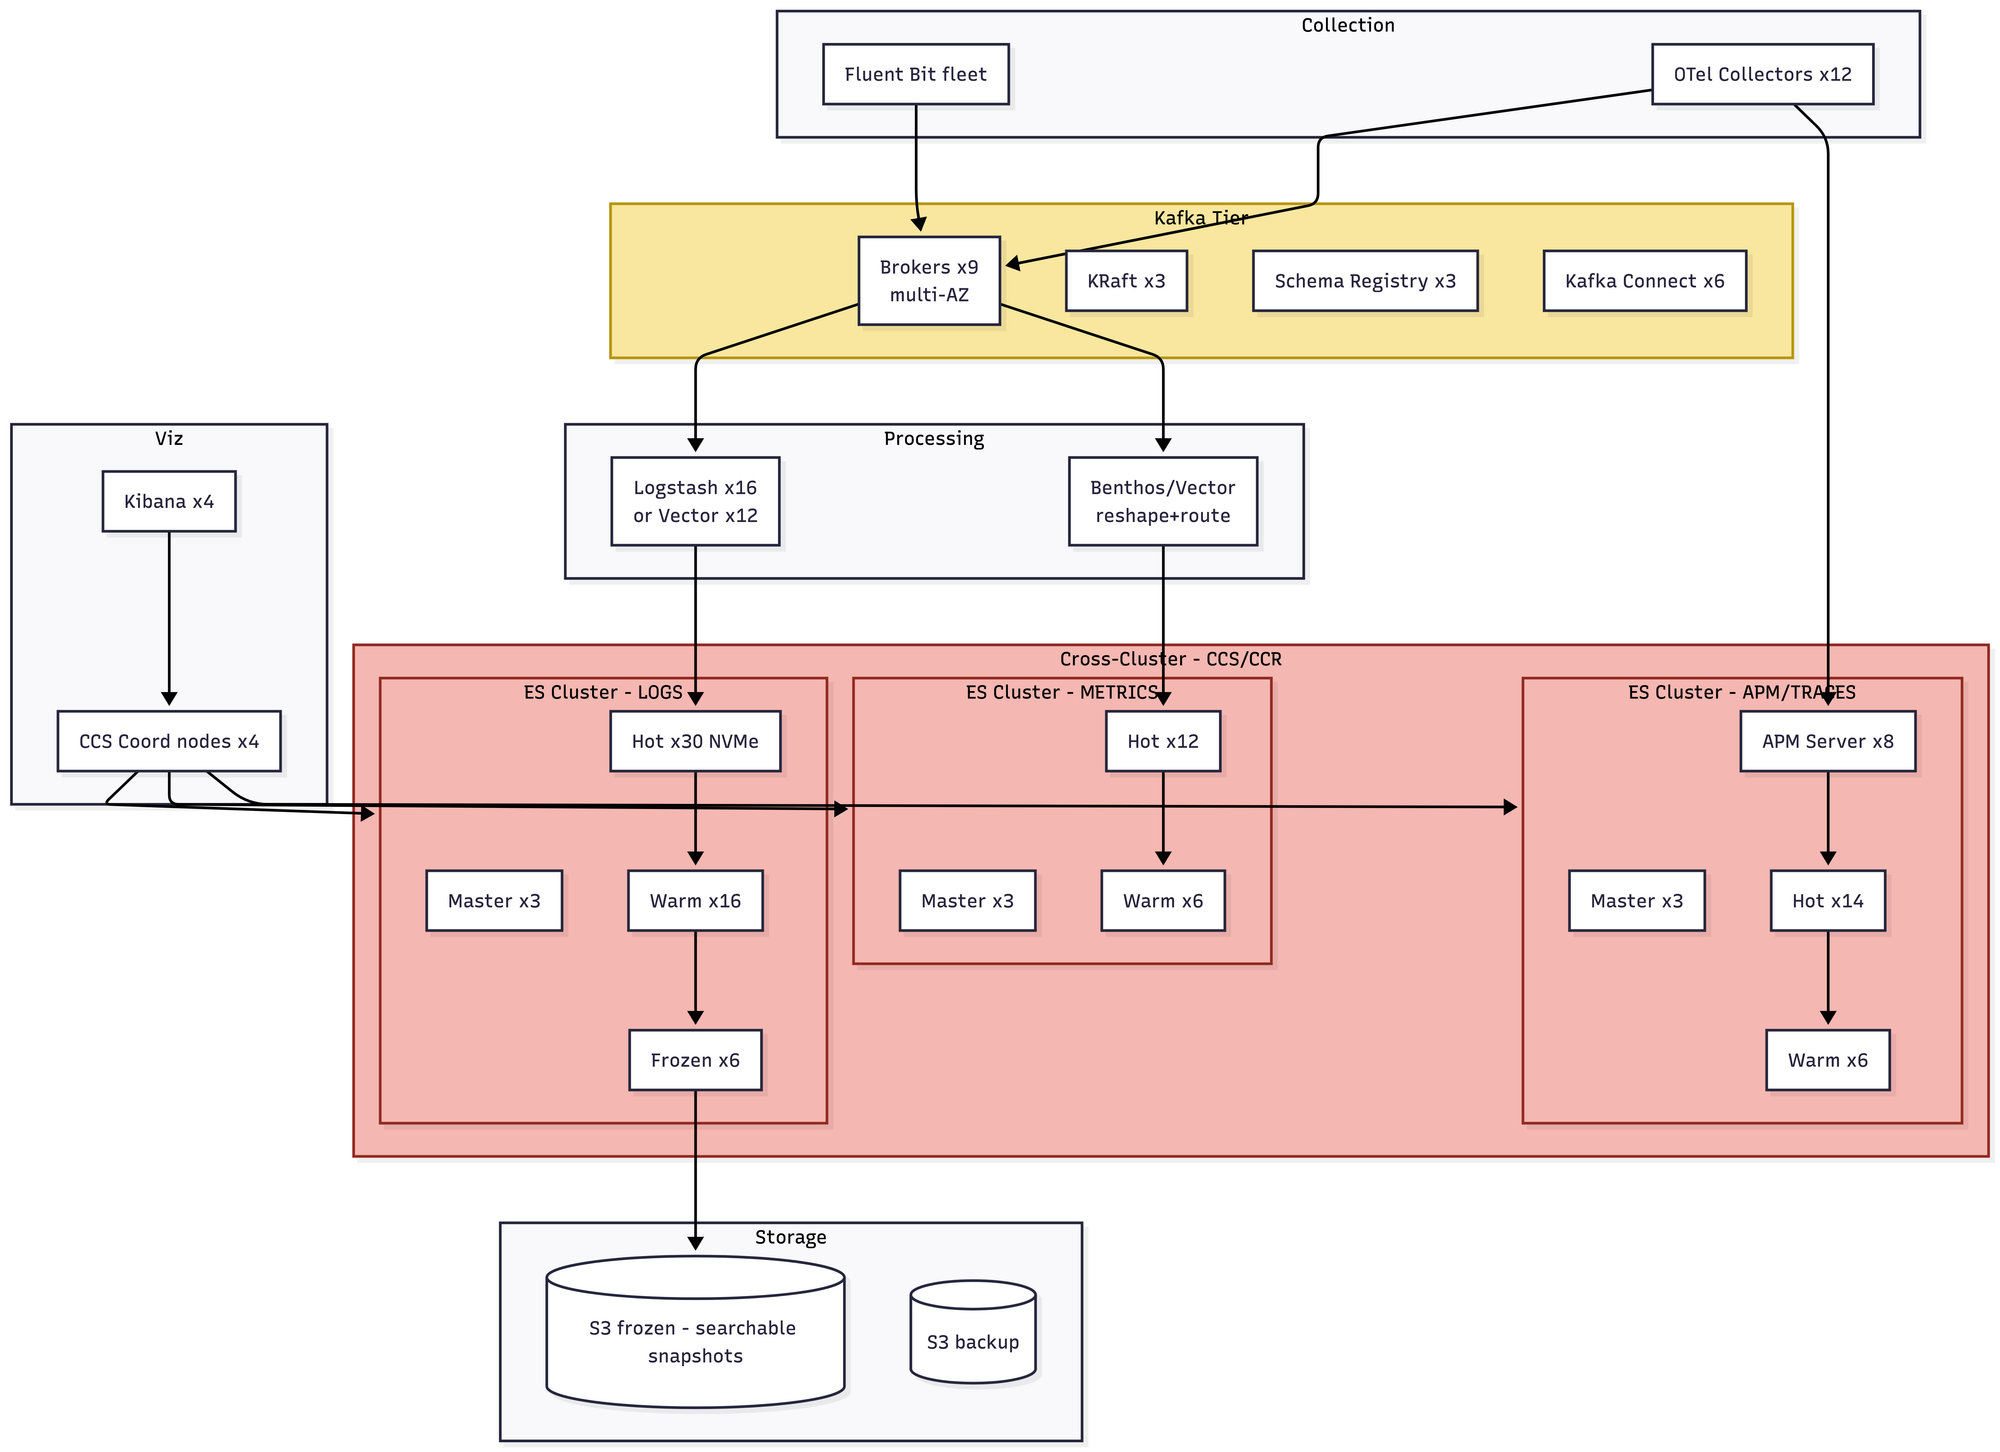
- You are now running three separate Elasticsearch clusters — one for logs, one for metrics, one for APM — federated through Cross-Cluster Search. Hot-tier NVMe cost dominates the bill. This is the scale at which teams start seriously evaluating alternatives, and where a lot of the recent migrations to ClickHouse have originated. Roughly $95–140K/month plus commercial licensing.
- You need people who are legitimate experts on Elasticsearch. Now thankfully Elastic just laid a ton of those people off, so they're probably possible to get, but still. Running this thing at this size is very complicated.
LGTM
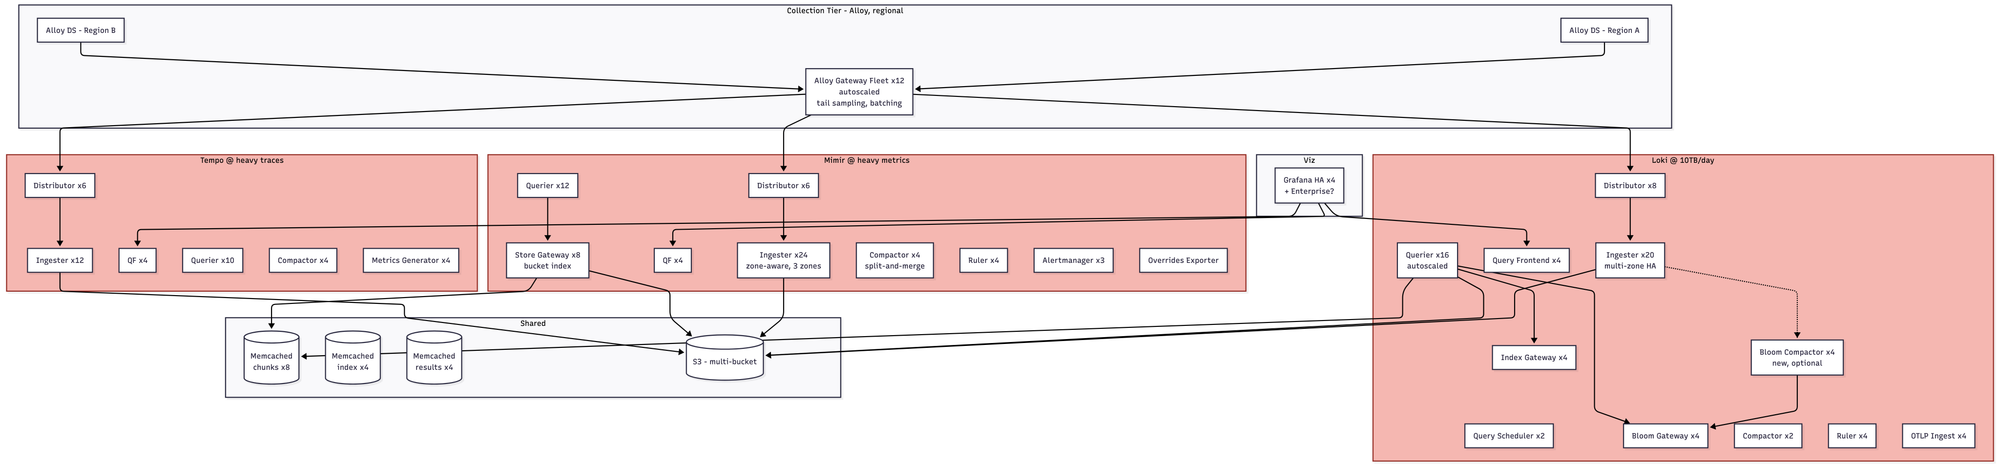
- Around 180+ pods, zone-aware everything, split-and-merge compaction, per-tenant limits, shuffle sharding to prevent noisy neighbors. You almost certainly have a dedicated observability platform team of three to five engineers at this point. If you don't, get ready for a bad fucking time. Roughly $55–85K/month.
Datadog
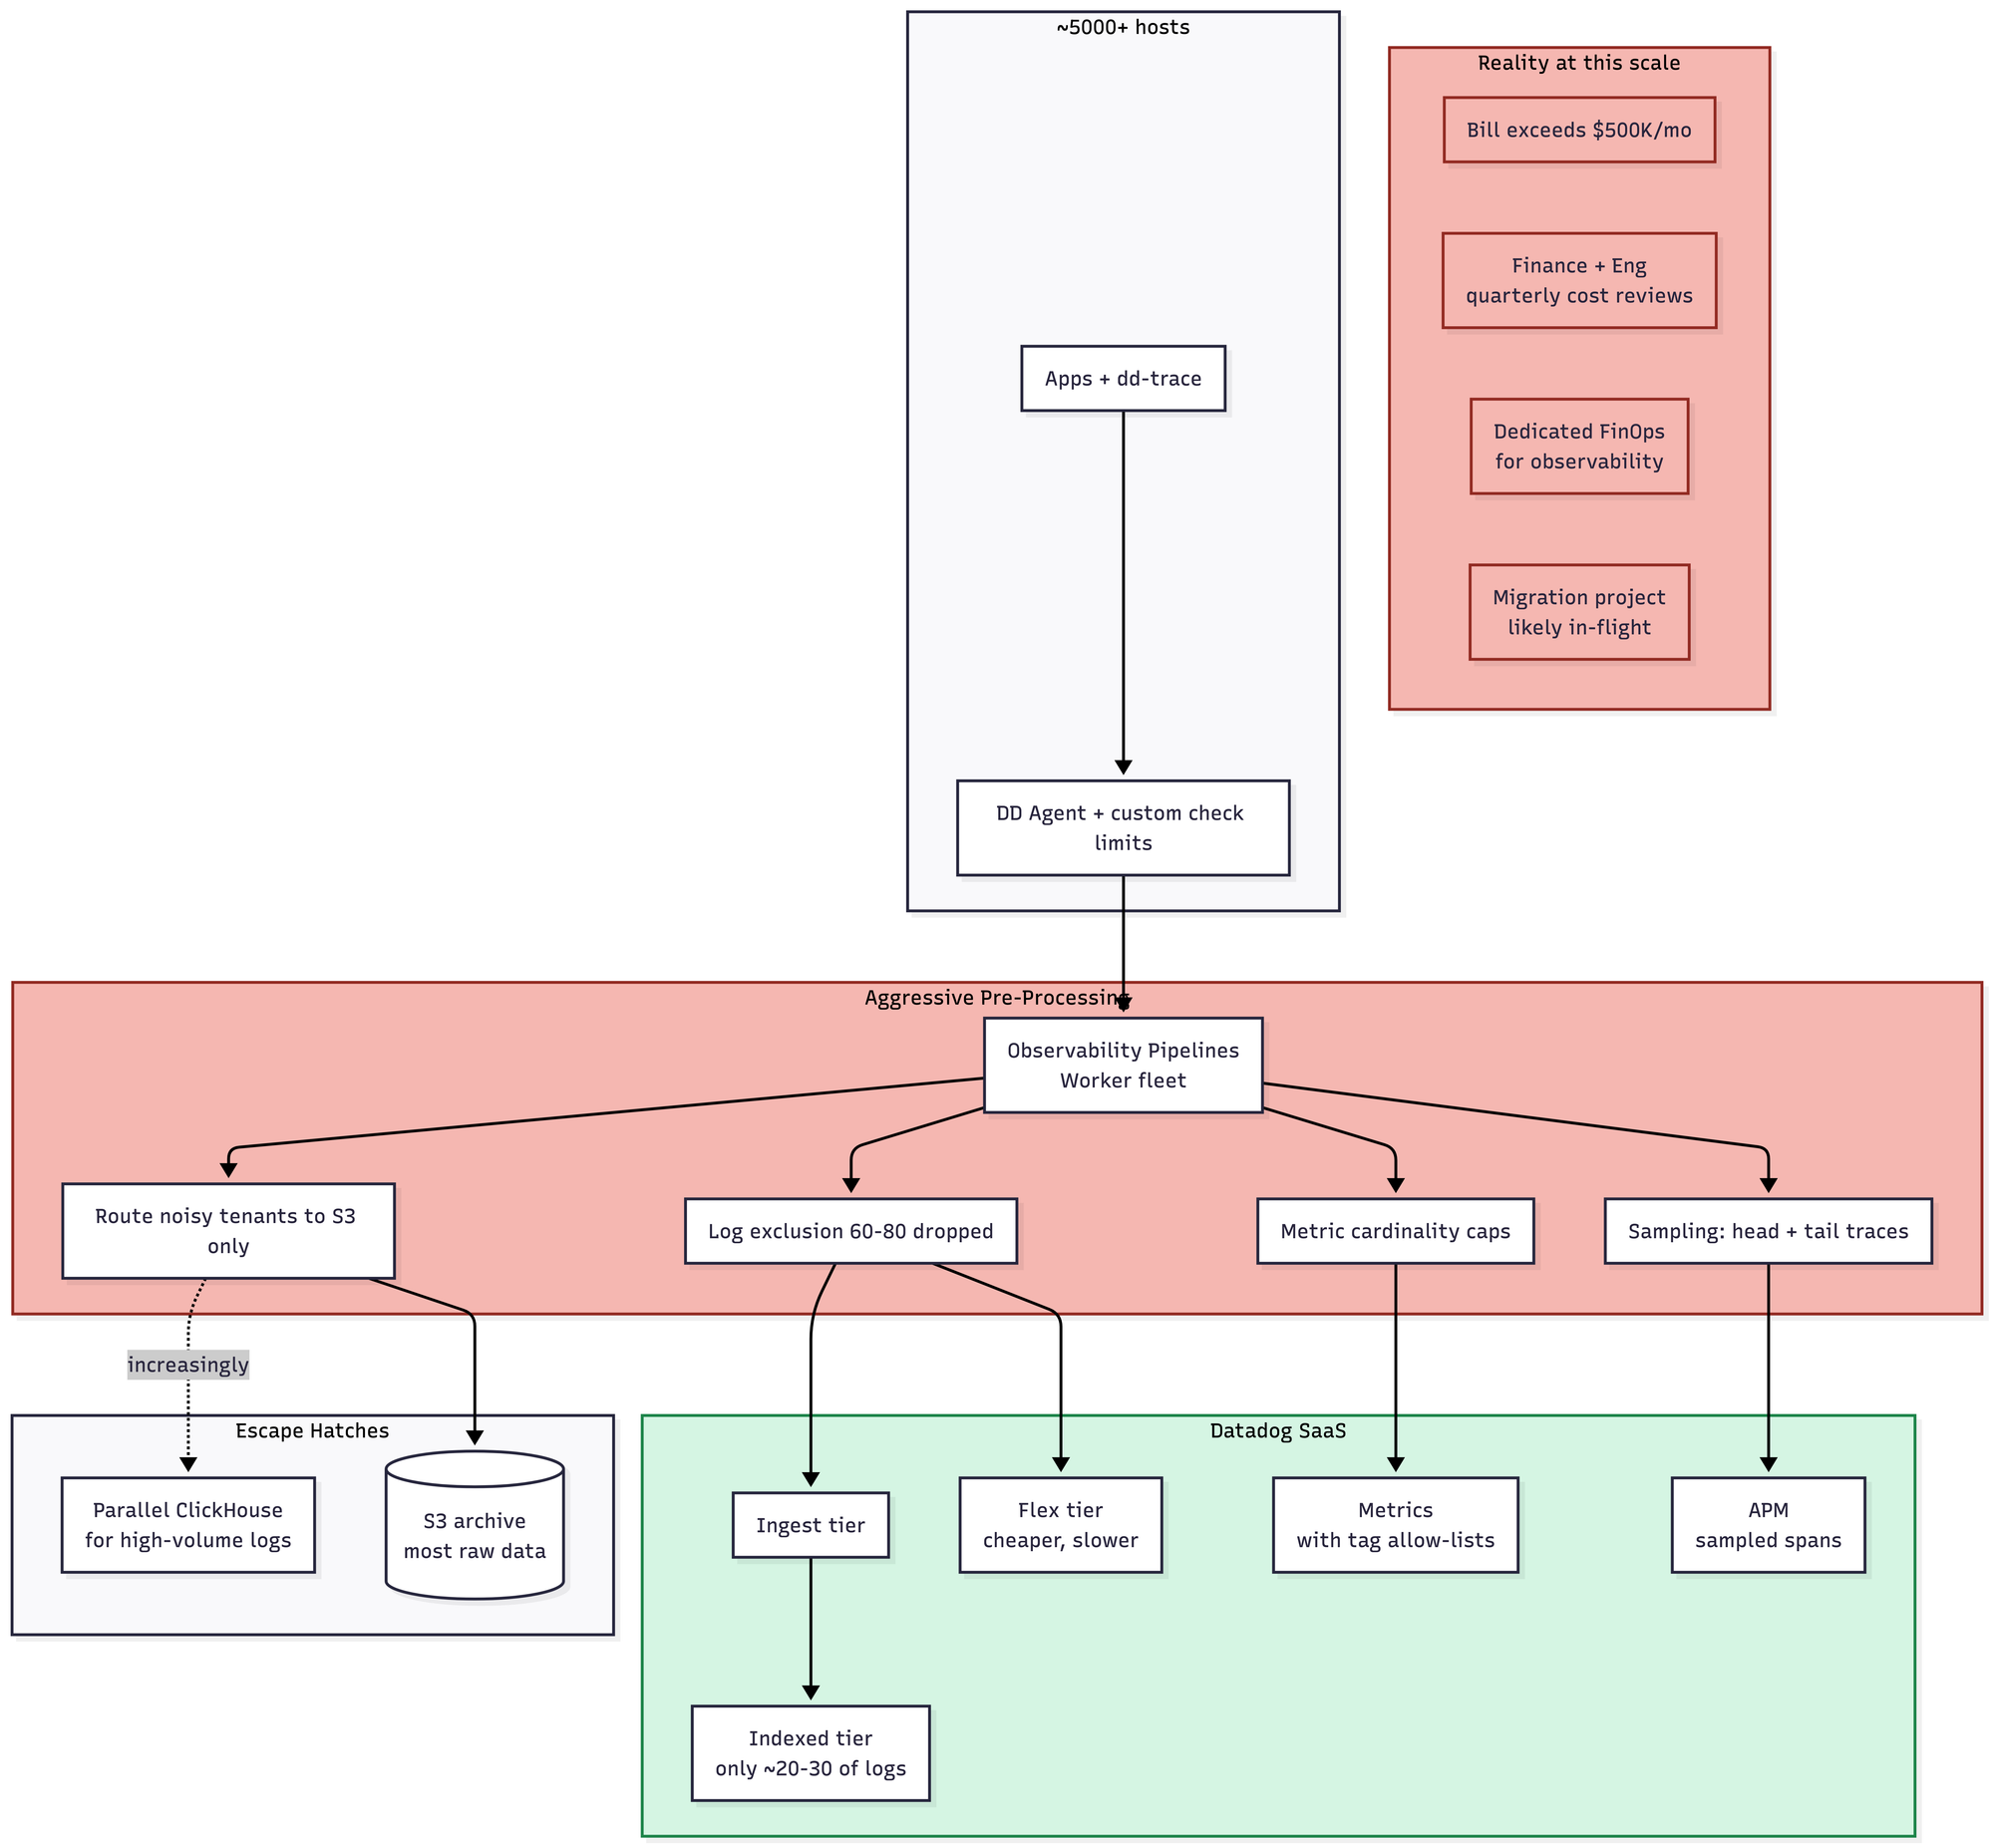
- Still very easy to run, in the strict sense that you don't run anything. But your bill is now measured in six or seven figures a month, and the org has almost certainly built a pre-processing pipeline team whose entire existence is dedicated to reducing that bill. Most companies at this scale have gone hybrid: Datadog for APM and high-value metrics, self-hosted (increasingly ClickHouse) for logs. The complexity paradox at this scale is that you now have Datadog's simplicity plus your pipeline complexity plus a second self-hosted stack. Pricing is all over the goddamn place. You might be over a $1 million a month here.
Clickhouse
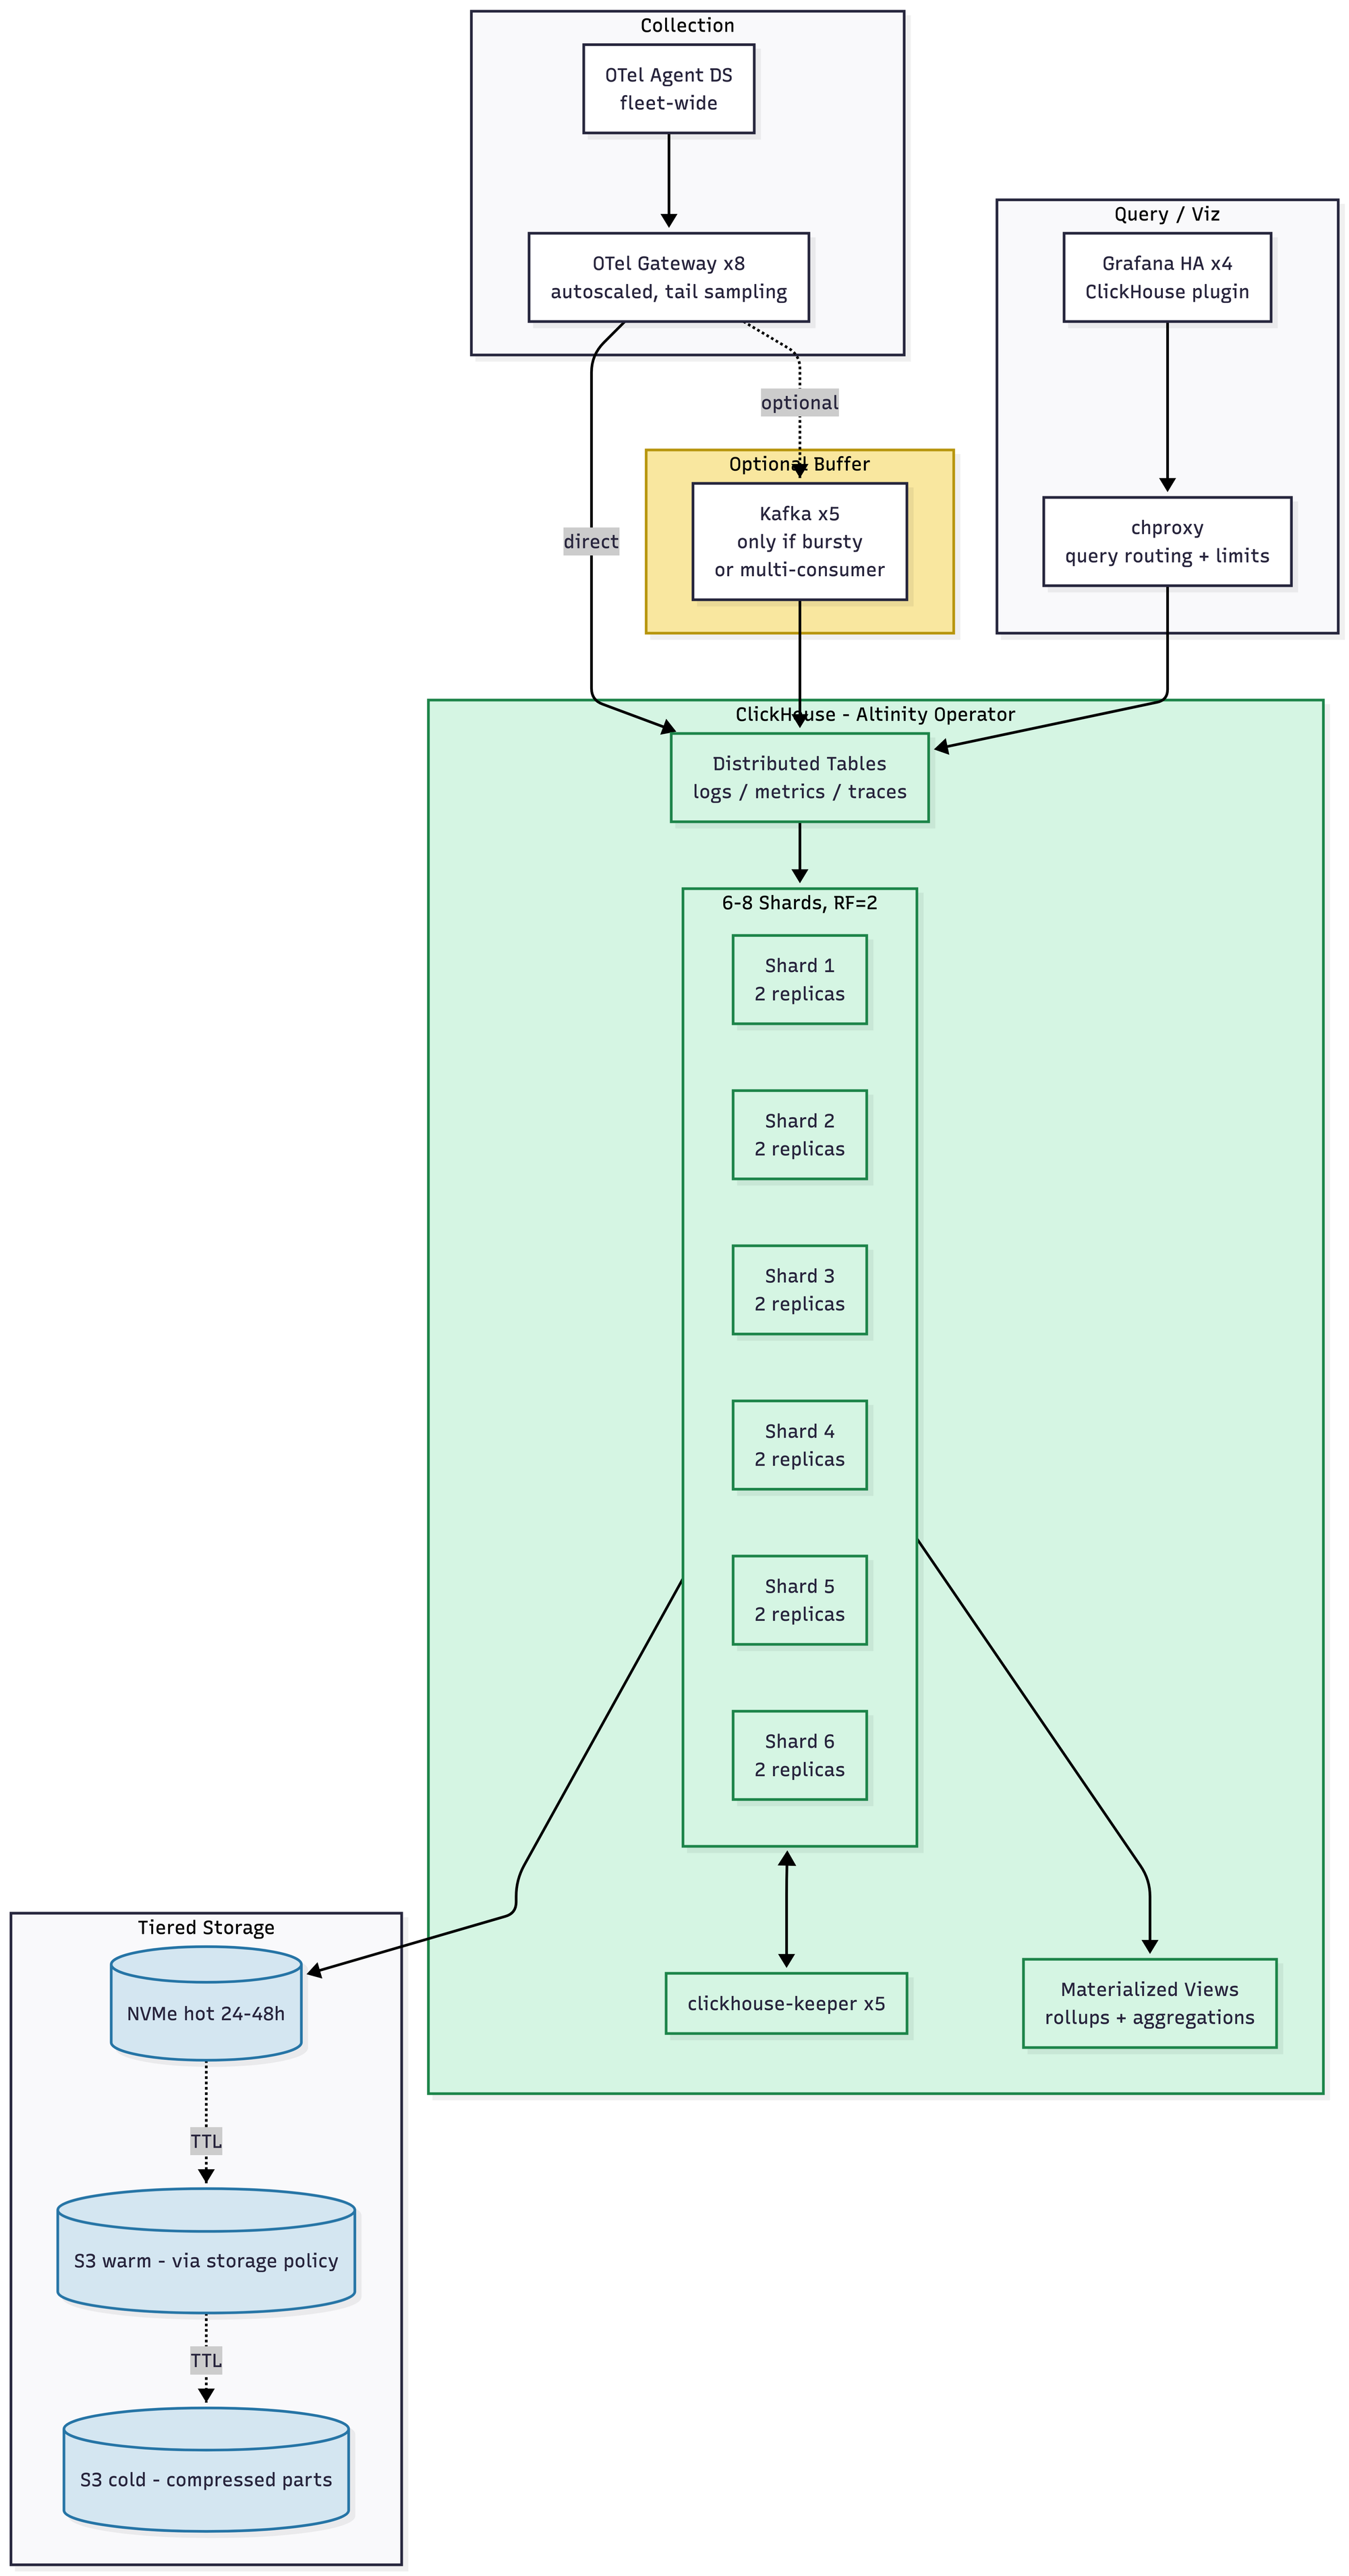
- Look at the diagram and then look back at the 1 TB diagram. It's the same diagram. There are more shards. That's the difference. Materialized views for rollups are now mandatory rather than optional. Schema design mistakes you made two years ago will start to hurt, so hopefully you didn't make many. Rebalancing after adding shards is still manual; most teams pre-provision or use clickhouse-copier or a dual-write migration when they need to grow the cluster. Kafka starts to become useful as a buffer for very bursty ingest, though it's not required. Roughly $18–28K/month.
What does this mean?
If you've read this far, the point is probably already obvious, but I want to say it directly.
Every observability stack works at 1 TB a day. If you're small, pick whatever your team already knows. Life is short. We're all just waiting for the robots to kick our heads off like soccer balls.
 V
VThe question is not which stack works today. The question is which stack still resembles itself two years from now, when your data volume has 5x'd and your team has 2x'd and the person who originally designed the whole thing has left the company.
Elasticsearch mutates. LGTM mutates. Datadog stays operationally simple but mutates financially into something that requires its own dedicated team of accountants and pipeline engineers just to keep the bill from spiraling.
ClickHouse just gets wider. You add shards. That's the whole trick.
There is a real cost to this: you have to eat the schema-design and query-engine complexity up front, at a scale where the other options are objectively easier. You will be, briefly, the one making things harder for your developers. They will not always appreciate this. But the trade you're making is that their experience — and yours — remains roughly the same as the data grows by an order of magnitude, and the next order of magnitude, and probably the one after that.
I have spent ten years watching observability stacks change shape underneath me while I tried to keep them running. ClickHouse is the first one that hasn't and that has been able to actually scale with me. That's pretty incredible.