And we're all doing it wrong (including me)
I have a confession. Despite having been hired multiple times in part due to my experience with monitoring platforms, I have come to hate monitoring. Monitoring and observability tools commit the cardinal sin of tricking people into thinking this is an easy problem. It is very simple to monitor a small application or service. Almost none of those approaches scale.
Instead monitoring becomes an endless series of small failures. Metrics disappeared for awhile, logs got dropped for a few hours, the web UI for traces doesn't work anymore. You set up these tools with the mentality of "set and forget" but they actually require ever increasing amounts of maintenance. Some of the tools break and are never fixed. The number of times I join a company to find an unloved broken Jaeger deployed has been far too many.

It feels like we have more tools than ever to throw at monitoring but we're not making progress. Instead the focus seems to be on increasing the output of applications to increase the revenue of the companies doing the monitoring. Very little seems to be happening around the idea of transmitting fewer logs and metrics over the wire from the client. I'm running more complicated stacks to capture massive amounts of data in order to use it less and less.
Here are the best suggestions I have along with my hopes and dreams. I encourage you to tell me I'm wrong and there are better solutions. It would (actually) make my life much easier so feel free: https://c.im/@matdevdug
Logs
They seem like a good idea right? Small little notes you leave for future you letting you know what is going on. Logs begin, in my experience, as basically "print statements stored to disk". Quickly this doesn't scale as disk space is consumed storing useless information that served a function during testing but now nobody cares about. "Let's use log levels". Alright now we're off to the confusing Olympics.
- Log Levels Don't Mean Anything
Syslog Levels
Python Levels
Golang
2. Log formats are all over the place
- JSON logging - easy to parse, but nested JSON can break parsers and the format is easy to change by developers
- Windows event log - tons of data, unclear from docs how much of a "standard" it is
- Common Event Format - good spec (you can read it here) but I've never seen anyone use it outside of network hardware companies.
- GELF - a really good format designed to work nicely with UDP for logging (which is a requirement of some large companies) that I've never heard of before writing this. You can see it here.
- Common Log Format - basically Apache logs:
127.0.0.1 user-identifier frank [10/Oct/2000:13:55:36 -0700] "GET /apache_pb.gif HTTP/1.0" 200 2326 - Nginx Log Format -
log_format combined '$remote_addr - $remote_user [$time_local] ' '"$request" $status $body_bytes_sent ' '"$http_referer" "$http_user_agent"';
No consensus on what logs are even for
Traditionally the idea is that you use Debug locally or in your dev environment, info was typically thrown away (you probably don't need to know when an application has done something normal in intense detail) and then you would log everything above info. The problem is, especially with modern microservices with distributed requests, logging is often the only place you can say with any degree of confidence "we know everything that happened inside of the system".
What often happens is that someone will attach some ID header to the request, like a UUID. Then this UUID is returned back to the end consumer and this is how customer service can look through requests and determine "what happened to this customer at this time". So suddenly the logging platform becomes much more than capturing print statements that happen when stuff crashes, it's the primary tool that people use to debug any problems inside of the platform.
This impacts customer service (what customer did what when), it impacts auditing requirements when they require that you keep a record of every interaction. So soon the simple requirement of "please capture and send everything above info" turns into a MUCH bigger project where the log search and capture infrastructure is super mission critical. It's the only way you can work backwards to what specifically happened with any individual user or interaction. Soon this feeds into business analytics where logs because the source of truth for how many requests you got or is this new customer using the platform, etc.
Suddenly your very simple Syslog system isn't sufficient to do this because you cannot have someone SSHing into a box to run a query for customer service. You need some sort of user-friendly interface. Maybe you start with an ELK stack, but running Elasticsearch is actually a giant pain in the ass. You try out SigNoz and that works but now it's a new mission critical piece of infrastructure that often kinda get thrown out there.
Chances are this isn't someones full-time job in your org, they just happened to pick up logging. It's not supposed to be a full-time gig so I totally get it. They installed a few Helm charts, put it behind an OAuth proxy and basically hoped for the best. Instead they get a constant flood of complaints from consumers of the logging system. "Logs are missing, the search doesn't work, my parser doesn't return what I expect".
Logs start to serve as business intelligence source of truth, customer service tool, primary debugging tool, way you know deploys worked, etc. I've seen this pattern at several jobs and often the frailness of this approach is met with a "well it's worked pretty well up to this point".
Not me, I just put it in cloud/SaaS/object storage.
Great, but since you need every log line your costs grow with every incoming customer. That sucks for a ton of reasons, but if your applications are chatty or you just have a lot of requests in a day, it can actually become a serious problem. My experience is companies do not anticipate that the cost of monitoring an application can easily exceed the cost of hosting the application even for simple applications.
Logging always ends up the same way. You eventually either: add some sort of not-log system for user requests that you care about, you stick with the SaaS and then aggressively monitor usage hoping for the best and/or you maintain a full end to end logging infrastructure that writes everything out to a disk you manage.
Logs make sense as a concept but they don't work as an actual tool unless you are willing to basically commit real engineering time every cycle to keeping the logging functional OR you are willing to throw a lot of cash at a provider. On top of that, soon you'll have people writing log parsers to alert on certain situations happening which seems fine, but then the logs become even MORE critical and now you need to enforce logging structure standards or convert old log formats to the new format.
The other problem is logs are such a stupid thing to have to store. 99.9999% of them are never useful, the ones that are look exactly like the rest of them and you end up sticking them in object storage forever at some point where no human being will ever interact with them until the end of time. The number of times I've written some variation on "take terabytes of logs nobody has ever looked at from A and move to B" scripts is too high. Even worse, the cost of tools like Athena to run a query against a massive bucket means this isn't something where you want developers splunking looking for info.
Suggestions
- If log messages are the primary way you monitor the entirety of a microservice-based system, you need to sit down and really think that through. What does it cost, how often does it have problems, can you scale it? Can you go without logs being stored?
- When you have a log that must be stored for compliance or legal reasons, don't stick it into the same system you use to store every 200 - OK line. Write it to a database (ideally) or an object store outside of the logging pipeline. I've used DynamoDB for this and had it work pretty well by sticking it in an SQS pipeline -> Lambda -> Dynamo. Then your internal application can query this and you don't need to worry about log expiration with DynamoDB TTL.
- If you aren't going to make logging a priority (which I totally respect), then you need to set and enforce a low SLA. An SLA of 99% is 7 hours and 14 minutes down a month. This is primarily a management problem, but it means you need to let the system experience problems to break people of the habit that it is an infinitely reliable source of truth.
- Your org needs a higher SLA than that? Pay a SaaS and calculate that into the cost of running the app. It's important to set billing labels with external SaaS as per-app as possible. You need to be able to go back to teams and say "your application is costing us too much in observability", not "the business as a whole is spending a lot on observability".
- Sampling is your friend. OpenTelemetry supports log sampling as an alpha feature here. It supports sampling based on priority which to me is key. You want some percentage of lower-priority logs but ideally as services mature you can continue to tune that down.
- If you have to write a bunch of regex to parse it start praying to whatever gods you believe in that it's a stable format
Hopes and Dreams
- Schema validation as a component of collectors for JSON logs. It seems weird that I can't really do this already but it should be possible to globally enforce whether logs are ingested into my system by ensuring they follow a org schema. It'd be great to enforce in the dev environment so people immediately see "hey logs don't show up".
- Sampled logs being more of a thing. My dream would be to tie them to deployments so I crank the retention to 100% before I deploy, as I deploy and then for some period of time after I deploy. The collector makes an API call to see what is the normal failure rate for this application (how many 2xx, 4xx, 5xx) and then if the application sticks with that breakdown increase the sampling.
I love what GCP does here for flow logs:
Even though Google Cloud doesn't capture every packet, log record captures can be quite large. You can balance your traffic visibility and storage cost needs by adjusting the following aspects of logs collection:
Aggregation interval: Sampled packets for a time interval are aggregated into a single log entry. This time interval can be 5 seconds (default), 30 seconds, 1 minute, 5 minutes, 10 minutes, or 15 minutes.
Sample rate: Before being written to Logging, the number of logs can be sampled to reduce their number. By default, the log entry volume is scaled by 0.5 (50%), which means that half of entries are kept. You can set this from1.0(100%, all log entries are kept) to0.0(0%, no logs are kept).
Metadata annotations: By default, flow log entries are annotated with metadata information, such as the names of the source and destination VMs or the geographic region of external sources and destinations. Metadata annotations can be turned off, or you can specify only certain annotations, to save storage space.
Filtering: By default, logs are generated for every flow in the subnet. You can set filters so that only logs that match certain criteria are generated.
I want that for everything all the time.
Metrics
Alright logs are crap and the signal to noise ratio is all off. We're gonna use metrics instead. Great! Metrics begin as super easy. Adding Prometheus-compatible metrics to applications is simple with one of the client libraries. You ensure that Prometheus grabs those metrics, typically with some k8s DNS regex or internal zone DNS work. Finally you slap Grafana in front of Prometheus, adding in Login with Google and you are good to go.
Except you aren't, right? Prometheus is really designed to be running on one server. You can scale vertically as you add more metrics and targets, but there's a finite cap on how big you can grow. Plus when there is a Prometheus problem you lose visibility into your entire stack at once. Then you need to start designing for federation. This is where people panic and start to talk about paying someone to do it.
Three Scaling Options
You can either:
1. Adopt a hierarchical federation which is one Prometheus server scraping higher-level metrics from another server. It looks like this:
The complexity jump here cannot be overstated. You go from store everything and let god figure it out to needing to understand both what metrics matter and which ones matter less, how to do aggregations inside of Prometheus and you need to add out-of-band monitoring for all these new services. I've done it, it's doable but it is a pain in the ass.
2. Cross-Service Federation which is less complicated to set up but has its own weirdness. Basically it's normal Prometheus at the bottom and then less cardinality Prometheus reading from them and you point everything at "primary" node for lack of a better term.
This design works but it uses a lot of disk space and you still have the same monitoring problems as before. Plus again it's a big leap in complexity (however in practice I find managing this level of complexity even solo to be doable).
I need an actual end-to-end metrics and alerting platform
Alright so my examples work fine for just short-term metrics. You can scale to basically "the disk size of a machine" which in practice in the cloud is probably fine. However all of this has been for the consumption of metrics as tools for developers. Similar to logs, as metrics get more useful they also get interest outside of the scope of just debugging applications.
You can now track all sorts of things across the stack and compare things like "how successful was a marketing campaign". "Hey we need to know if Big Customer suddenly gets 5xxs on their API integration so we can tell their account manager." "Can you tell us if a customer stops using the platform so we know to reach out to them with a discount code?" These are all requests I've gotten and so many more, at multiple jobs.
I need A Lot of Metrics Forever
So as time goes on inevitably the duration of metrics people want you to keep will increase, as will the cardinality. They want more specific information about not just services, but in many cases customers or specific routes. They'll also want to alert on those routes, store them for (maybe) forever and do all sorts of upstream things with the metrics.
This is where it starts to get Very Complicated.
Cortex
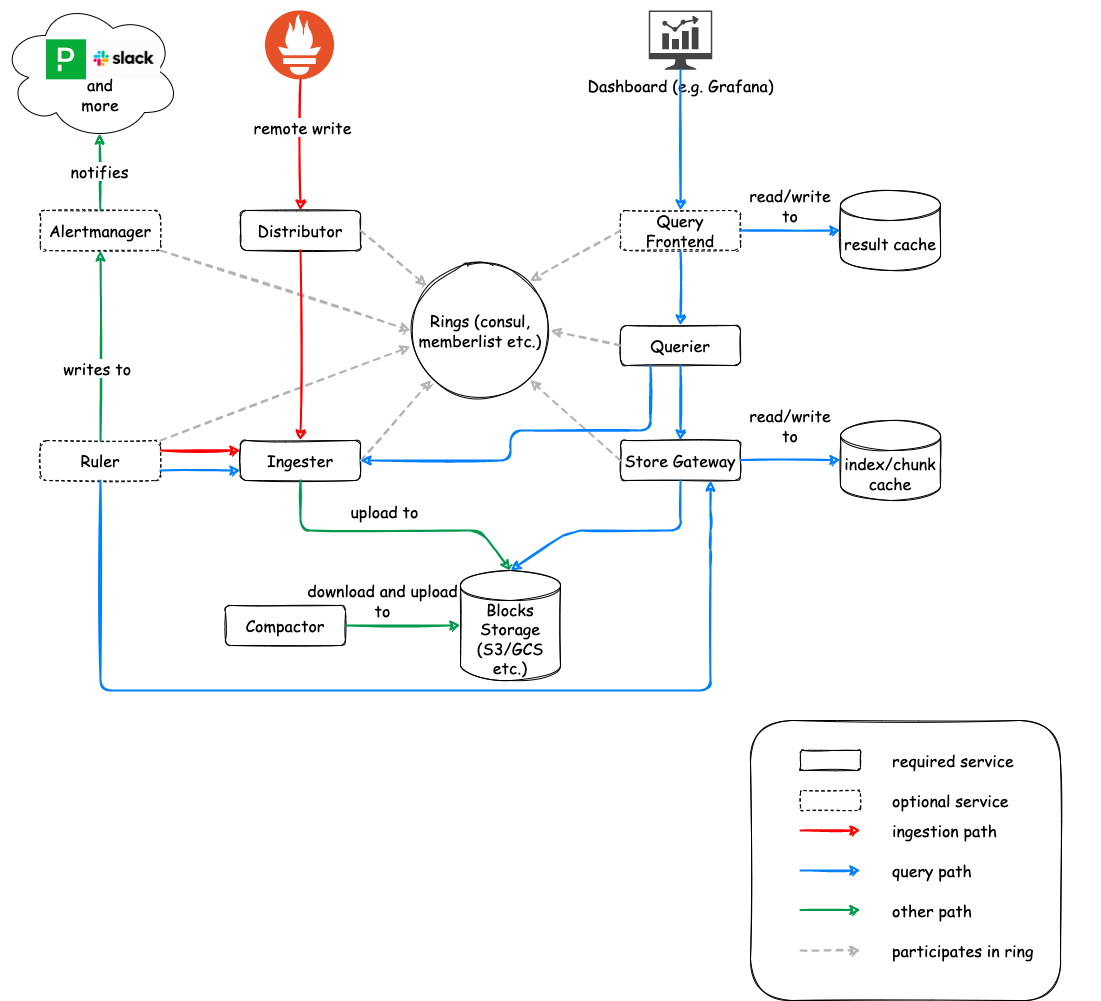
Cortex is a push-service, so basically you push the metrics to it from the Prometheus stack and then process it from there. There are some really nice features with Cortex, including deduplicating incoming samples from redundant Prometheus servers. So you can stand up a bunch of redundant Prometheus, point them at Cortex and then only store one metric. For this to work though you need to add a key-value store, so add another thing to the list. Here are all the new services you are adding:
- Distributor
- Ingester
- Querier
- Compactor
- Store gateway
- Alertmanager (optional)
- Configs API (optional)
- Overrides exporter (optional)
- Query frontend (optional)
- Query scheduler (optional)
- Ruler (optional)
I've used Cortex once, it's very good but it is a lot of work to run. Between the Prometheus servers you are running and managing this plus writing the configs and monitoring it, it has reached Big Project status. You probably want it running in its own k8s cluster or server group.
Thanos

Similar goals to Cortex, different design. It's a sidecar process that ingests the metrics and moves them using (to me) a more simple modular system. I've only just started to use Thanos but have found it to be a pretty straight-forward system. However it's still a lot to add on top of what started as a pretty simple problem. Of the two though, I'd recommend Thanos just based on ease of getting started. Here are the services you are adding:
- Sidecar: connects to Prometheus, reads its data for query and/or uploads it to cloud storage.
- Store Gateway: serves metrics inside of a cloud storage bucket.
- Compactor: compacts, downsamples and applies retention on the data stored in the cloud storage bucket.
- Receiver: receives data from Prometheus’s remote write write-ahead log, exposes it, and/or uploads it to cloud storage.
- Ruler/Rule: evaluates recording and alerting rules against data in Thanos for exposition and/or upload.
- Querier/Query: implements Prometheus’s v1 API to aggregate data from the underlying components.
- Query Frontend: implements Prometheus’s v1 API to proxy it to Querier while caching the response and optionally splitting it by queries per day.
This is too complicated I'm gonna go with SaaS
Great but they're expensive. All the same rules as logging apply. You need to carefully monitor ingestion and ensure you aren't capturing high-cardinality metrics for no reason. Sticker shock when you get the first bill is common, so run some estimates and tests before you plug it in.
Suggestions
- Define a hard limit for retention for metrics from day 1. What you are going to build really differs greatly depending on how long you are gonna keep this stuff. I personally cap the "only Prometheus" design at 30 days of metrics. I know people who go way longer with the federated designs but I find it helps to keep the 30 days as my north star of design.
- If metrics are going to be your primary observability tool, don't do it in half measures. It's way harder to upgrade just Prometheus once the entire business is relying on it and downtime needs to be communicated up and down the chain. I'd start with either Thanos or Cortex from launch so you have a lot more flexibility if you want to keep a lot of metrics for a long period of time.
- Outline an acceptable end state. If you are looking at a frightening number of metrics, Cortex is a better tool for sheer volume. I've seen a small group of people who knew it well manage Cortex at 1.6 million metrics a second with all the tools it provides to control and process that much data. However if the goal is less about sheer volume and more about long-term storage and accessibility, I'd go with Thanos.
- Unlike a lot of folks I think you just need to accept that metrics are going to be something you spend a lot of time working with. I've never seen a completely hands-off system that Just Works at high volume without insane costs. You need to monitor them, change their ingestion, tinker with the configuration, go back, it's time consuming.
Tracing
Logs are good for knowing exactly what happened but have a bad signal to noise ratio. Metrics are great for knowing what happened but can't work for infinite cardinality. Enter tracing, the hot new thing from 5 years ago. Traces solve a lot of the problems from before allowing for tremendous amounts of data to be collected about requests through your stack. In addition it allows for amazing platform-agnostic monitoring. You can follow the request from your app to your load balancer to backend and microservices and back.
Now the real advantage of tracing to me is it comes out of the box with the idea of sampling. It is a debugging and troubleshooting tool, not something with compliance or business uses. Therefore it hasn't become completely mucked up with people jamming all sorts of weird requirements in there over time. You can very safely sample because its only for developer troubleshooting.
I'll be honest with you. My experience with setting tracing up has been "use SaaS and configure tracing". The one I've used the most and had the best experience with is Cloud Trace. It was easy to implement, controlling pricing was pretty straight-forward and I liked the troubleshooting element
The problem with me and tracing is nobody uses it. When I monitor the teams usage of traces, it is always a small fraction of the development team that ever logs in to use them. I don't know why the tool hasn't gotten more popularity among developers. It's possible folks are more comfortable with metrics and logs or perhaps they don't see the value (or maybe they feel like they know where the time-consuming services are in their stack so they just need the round-trip time off the load balancer). So far I haven't seen tracing "done right".
Hopefully that'll change some day.
Conclusion
Maybe I'm wrong about monitoring. Maybe everyone else is having a great time with it and I'm the one struggling. My experience has been monitoring is an unloved internal service of the worst kind. It requires a lot of work, costs a lot of money and never makes the company any money.